INVITE-ONLY SCRIPT
更新済 Trend, Chart Patterns & Market Structure Indicator [TradeDots]
The "Trend, Chart Patterns & Market Structure Indicator" is engineered to identify pivotal price action points, revealing shifts in market dynamics. This tool aids traders to simplify any trading market in recognizing significant price levels, enhancing decision-making in diverse market conditions.
📝 HOW IT WORKS
Pivot Identification
The indicator detects pivots in price action using a complex mathematical model by analyzing a window of candlesticks to capture significant reversal patterns. It examines a series of bars, focusing on their open, high, low, close, and changes in these values, to pinpoint potential market turning points.
Support and Resistance Lines
Chart Patterns Analysis

Market Structure Shifts
Types of Market Structure Shifts
🛠️ HOW TO USE
Chart Visualization
Reversal Signals
❗️LIMITATIONS
RISK DISCLAIMER
Trading involves substantial risk, and most traders may incur losses. All content, tools, scripts, articles, and education provided by TradeDots are for informational and educational purposes only.
📝 HOW IT WORKS
Pivot Identification
The indicator detects pivots in price action using a complex mathematical model by analyzing a window of candlesticks to capture significant reversal patterns. It examines a series of bars, focusing on their open, high, low, close, and changes in these values, to pinpoint potential market turning points.
Support and Resistance Lines
- Calculation: Automatically draws lines at key price pivots in bullish and bearish markets.
- Significance: Aligning support and resistance levels highlights strong demand or supply zones, reinforcing trading biases. When multiple lines converge near a price level, it indicates robust support or resistance, as many traders focus on these levels for placing trades.
Chart Patterns Analysis
- Formation: Utilizes four pivots to identify patterns such as ascending/descending channels, contraction, and expansion patterns.
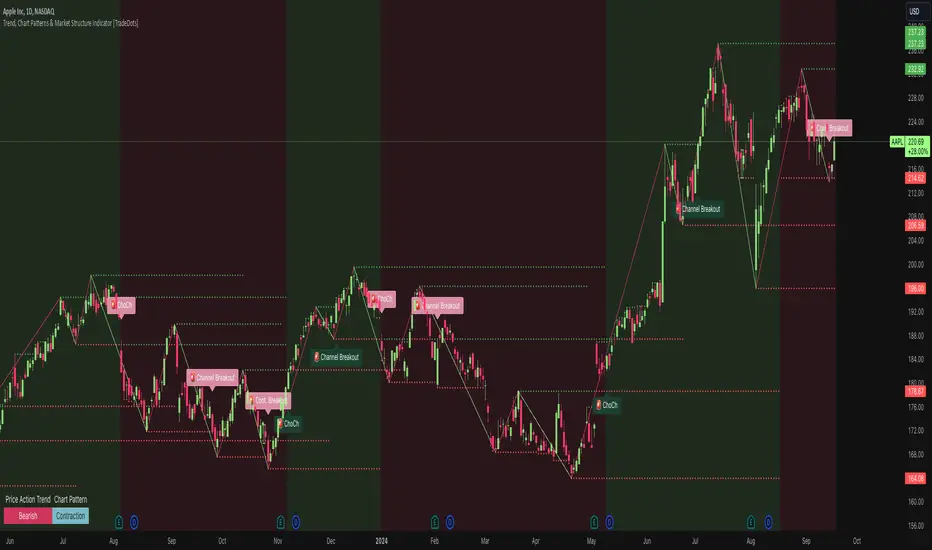
- Visualization: Background colors (green for bullish, red for bearish) help identify market trends.
Market Structure Shifts
- Detection: Identifies price breakouts above or below previous support and resistance, indicating changes in market structure.
- Confirmation: Highlights shifts in market character, aiding in trend reversal anticipation.
Types of Market Structure Shifts
- Channel Breakout: The price breaks out from the current channel's resistance level.
- Rev. Breakout: The price breaks out from a contraction pattern, moving in the opposite direction of the previous market trend.
- Continuation Breakout: The price breaks out from a contraction pattern, continuing the previous market trend.
- Change of Character (ChoCh): The price breaks out from either support or resistance, causing a change in the market trend.
🛠️ HOW TO USE
Chart Visualization
- Color Coding: Background colors signify market trends, with green indicating bullish and red indicating bearish conditions.
- Pattern Recognition: Identifies and labels patterns, providing insights into current market sentiment.
Reversal Signals
- Signal Labels: Detects shifts in market structure indicating potential entry and exit points.
❗️LIMITATIONS
- Market Noise: Accuracy may decrease in volatile and noisy markets.
- Trend Confirmation Delay: Market trends are only confirmed once the price breaks out from support or resistance, potentially causing delays.
RISK DISCLAIMER
Trading involves substantial risk, and most traders may incur losses. All content, tools, scripts, articles, and education provided by TradeDots are for informational and educational purposes only.
リリースノート
- Improved trend detector accuracy
- Minor bug fix
招待専用スクリプト
このスクリプトは作者が承認したユーザーのみアクセス可能です。使用するにはアクセス申請をして許可を得る必要があります。通常は支払い後に承認されます。詳細は下記の作者の指示に従うか、tradedotsに直接お問い合わせください。
TradingViewは、作者を完全に信頼し、スクリプトの動作を理解していない限り、有料スクリプトの購入・使用を推奨しません。コミュニティスクリプトには無料のオープンソースの代替が多数あります。
作者の指示
Get access to our exclusive indicators: tradedots.xyz All content provided by TradeDots is for informational & educational purposes only. Past performance does not guarantee future results.
免責事項
この情報および投稿は、TradingViewが提供または推奨する金融、投資、トレード、その他のアドバイスや推奨を意図するものではなく、それらを構成するものでもありません。詳細は利用規約をご覧ください。