INVITE-ONLY SCRIPT
Specter Alpha-Omega Volatility Index™
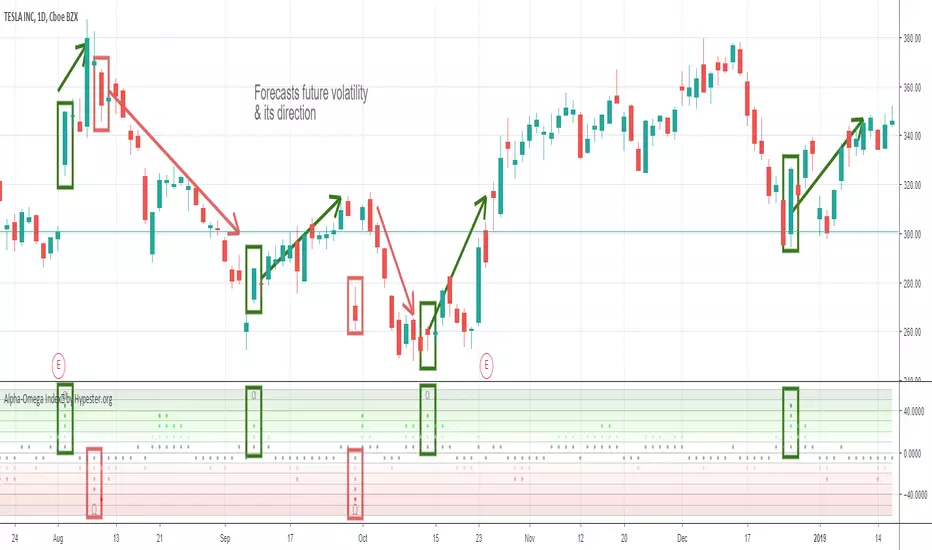
Meet the Alpha-Omega Volatility custom indicator by Specter
This premium volatility indicator uses a series of models to compare historical volatility, and by using a series of noise reduction techniques, it only gives you the very best signals. This indicator shows you aggressive reversals, which are often the most profitable.
The customization options already come with pre-sets, and it's as simple as one click. It comes with Aggressive, Moderate, Conservative and Ultra Conservative behaviors filters.
Also, it offers an interest zone indicator so you can start paying attention to the chart before it happens when trading extra volatile stocks timing is crucial and you want to be ready before the action begins.
The way you use it is pretty simple, you look for divergences. When you have a bullish movement, and you see high negative volatility appearing in the Alpha-Omega indicator, it means a strong reversal/spike is coming. The same goes for bearish reversals, just the opposite logic. You also get an extra layer of confirmation which is the Alpha/Omega characters; they only appear with the most robust volatility prediction. It's up to your trading strategy to decide how conservative you are and which signals you will follow.
It works on any market/security/asset/timeframe.
Ready to ride some spikes?
招待専用スクリプト
このスクリプトは作者が承認したユーザーのみアクセス可能です。使用するにはアクセス申請をして許可を得る必要があります。通常は支払い後に承認されます。詳細は下記の作者の指示に従うか、spectertradingに直接お問い合わせください。
TradingViewは、作者を完全に信頼し、スクリプトの動作を理解していない限り、有料スクリプトの購入・使用を推奨しません。コミュニティスクリプトには無料のオープンソースの代替が多数あります。
作者の指示
免責事項
この情報および投稿は、TradingViewが提供または推奨する金融、投資、トレード、その他のアドバイスや推奨を意図するものではなく、それらを構成するものでもありません。詳細は利用規約をご覧ください。