INVITE-ONLY SCRIPT
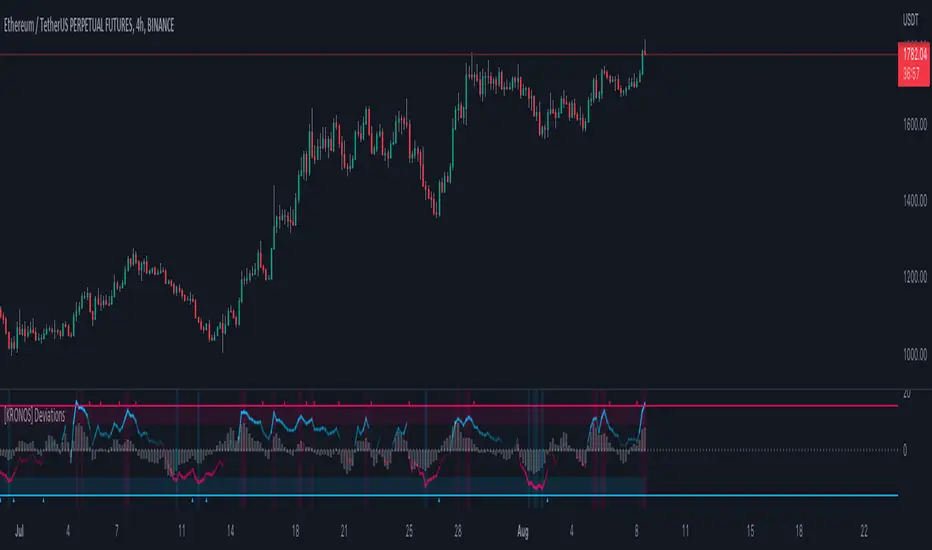
[KRONOS] Deviations
Description
This indicator calculates the differences between the current price and the local support or resistance, and normalizes it into a range.
The value basis is calculated from a defined period of time that is then multiplied to get a standard deviations and a max. and min. value subtracted and divided into a final value.
It includes
Extreme zones. This value appears as blue and red lines which deviates from the oversold to overbought range.
Momentum. Lower time frame momentum is represented by a gray histogram as well as a signal line oscillating from a red to blue color.
Strong reversal. Red ( bearish ) and blue ( bullish ) columns will appear on the histogram when our algorithm detects that the strength of momentum is coming to an end indicative of a trend reversal.
Trend confirmation. Red or blue arrows will act as a trend confirmation.
Support and resistance . The zero line will frequently serve as a S/R area.
Divergences. You can use this indicator to detect potential pivot areas.
How to use?
Sell/Short when the histogram shows a red column and the signal line is in or above the overbought area (colored in red).
Buy/Long when the histogram shows a blue column and the signal line is in or below the oversold area (colored in blue).
extra tip: if you entered a trade based on the above conditions, you can partially increase your position each time you see a confirmation arrow.
招待専用スクリプト
このスクリプトは作者が承認したユーザーのみアクセス可能です。使用するにはアクセス申請をして許可を得る必要があります。通常は支払い後に承認されます。詳細は下記の作者の指示に従うか、kronos-algoに直接お問い合わせください。
TradingViewは、作者を完全に信頼し、スクリプトの動作を理解していない限り、有料スクリプトの購入・使用を推奨しません。コミュニティスクリプトには無料のオープンソースの代替が多数あります。
作者の指示
Learn more at: https://kronos-trading.com/indicators
Our indicators are suitable for all markets: Crypto, Forex, stocks, etc.
Learn more at: kronos-trading.com/indicators
Our indicators are suitable for all markets: Crypto, Forex, stocks, etc.
Our indicators are suitable for all markets: Crypto, Forex, stocks, etc.
免責事項
この情報および投稿は、TradingViewが提供または推奨する金融、投資、トレード、その他のアドバイスや推奨を意図するものではなく、それらを構成するものでもありません。詳細は利用規約をご覧ください。