PROTECTED SOURCE SCRIPT
更新済 ENRER RB
rubber band
リリースノート
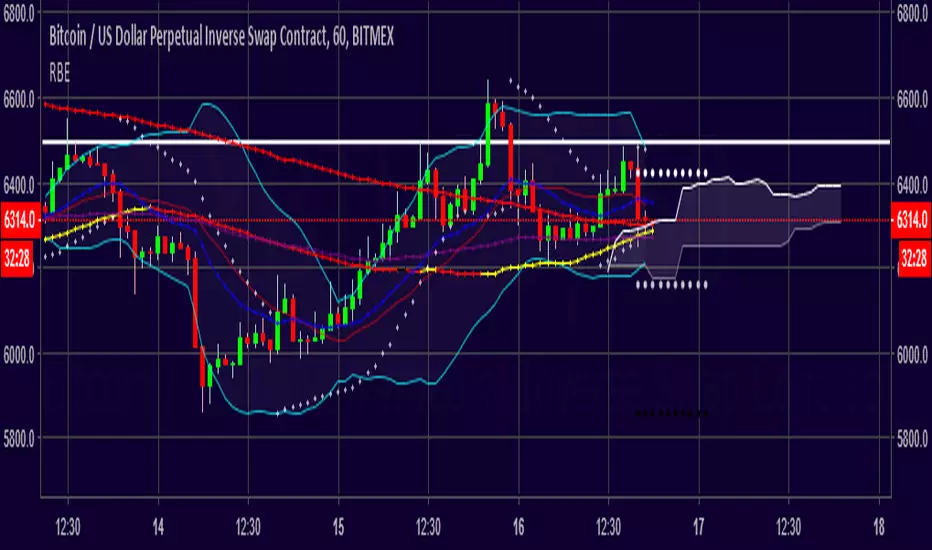
Bollinger Bands : A well known system for defining volatility and Squeeze / expansion
Moving Averages :
SMA 50 (color coded based on direction) for showing the dynamic trend line
EMA 15 for showing local resistance / support lines
SMA 100 and 200 for showing higher time frame resistance/ support or dynamic trend lines
Ichimoko Cloud:
From all the Ichimoko indicator system, it's cloud is one of the best parts to show you the future possible resistance/support zones but it will occlude the chart, so, why not have the needed part?
Parabolic Sar :
One the good indicators to show the shift in the momentum and the power behind it, color coded for easier definition of bullish from bearish
::::: IN NEW V. you can active to show ichimoku lines too ::::::
リリースノート
Pivot Points And Fibonacci Active from inputs
保護スクリプト
このスクリプトのソースコードは非公開で投稿されています。 ただし、制限なく自由に使用できます – 詳細はこちらでご確認ください。
免責事項
この情報および投稿は、TradingViewが提供または推奨する金融、投資、トレード、その他のアドバイスや推奨を意図するものではなく、それらを構成するものでもありません。詳細は利用規約をご覧ください。
免責事項
この情報および投稿は、TradingViewが提供または推奨する金融、投資、トレード、その他のアドバイスや推奨を意図するものではなく、それらを構成するものでもありません。詳細は利用規約をご覧ください。