INVITE-ONLY SCRIPT
更新済 Waves + XABCD v.1.0
Advanced harmonic patterns scanner optimazed for Wave theory for Low or Medium wave rules.
It finds on the candle chart:
- Existing pattern with realized target in historic data.
- Potencial patterns with realized and potencial targets.
- Estimated patterns that may become potencial with their potencial targets (it updates instantly with the price change (before closing the bar). Such estimation can be confirmed or invalidated in minutes, but can give an advantage and be usefull on higher intervals.
Supports modified traiding patterns:
B.38
B.50
B.618
B.786
B.886
Shark
Cypher
Formation 5-0
Script with limited access, contact author to get authorization
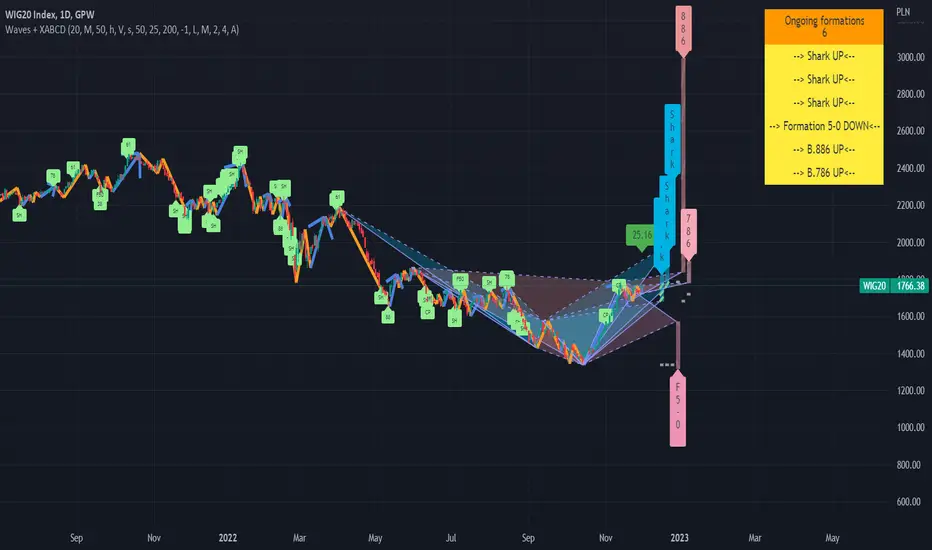
Existing patterns visualization:

Potencial pattern visualization:

On the chart we can see few potencial patterns ( Sharks & Cyphers ). First target of first formation was realized and trend was changed. Chances of reaching targets in each pattern kind we can check by moving mouse over the label. tooltip will show:
- how many patterns are in historical data on this chart
- targets with % of cases in historical data on this chart when target was reached.
WARNING !!!
For each scanner configration and "D point limit" we can get different values. Also numbers of bars (traidingView account type) will change results. You can contact us for details how to optimaze settings for better performance.
Estimated patterns visualization:

On the chart we can see 2 estimated patterns based on current up trend. We can see that trend was already confirmed and will not change in this bar, but "if he had changed" the patterns will be accepted as potencial giving more arguments for move down.
Patterns performance data:
Below we can see chart with stats params set to "%". In the table on right we can see how many patterns were detected on the chart for the current configuration and how many of them reached particular level within the current D limit.

For each scanner configration and "D point limit" we can get different values. Also numbers of bars (traidingView account type) will change results. You can contact us for details how to optimaze settings for better performance.
Script settings:
| XABCD Scanner |
XABC dist limit - Specifies the maximum distance between successive pattern vertex .
Trend type - Specify which wave type should be used.
precision ‰ - It determines the maximum deviations from the conditions that must be met by the patterns. It also causes enlarge / blur of targets.
B.38, B.50, B.618, B.786, B.886, Shark, Cypher, Formation 5-0 - Filter specifying which patterns should be detected and allowing to set pattern color.
| XABCD Scanner Visualization |
You can configure visualziation for each pattern type separatelu:
Existing - Patterns in the historic data
Potencial - Patterns with known XABC vertrex, but without confirmed D.
Estimated - Dynamic patterns with not confirmed C vertex . After extreme formed they can be confirmed or invalidated.
Shape - Check if you want to see pattern shape.
Target - Check if you want to see posibble targets (In case of high precision value, lines become diagonal).
Label - Decide what format should have label. You can pick from: Fullname, shortname, vertical, hidden.
Targets: Filled/Not filled - Allow to change colors used for targets visualization.
Fill: targets/shape - Transparency param of the drawings.
| XABCD Scanner Statistics |
D point limit - A treshold for filter that counts statistics. If D will be reach after passing treshold it will not count as success in the statistics.
over limit color - Color used for patterns line visualization if D is over limit set in previous point.
pattern filter checkbox - Showing dialog with list of potencial patterns.
pattern filter - Field allowing to pick potencial pattern to show.
stats - Shows/hides stats table.
| Trend visualization |
Type - Specify switch what kind of wave should be drawn.
Confirmation - Draw "C" label if wave was confirmed and will not change in this bar. If wave is changing on this bar shows distance from the treshold.
Shadow - Draws second trendline based on the wave extremes.
Low/Mid line width and color - Wave drawing configuration.
| Impuls visualization |
Impuls - Picking graphical reprezentation of first bullish arrow.
Impuls color - Color of the first bullish arrow.
Draw arrow - Drawing arrow on the end of impuls wave.
Troubleshooting:
In case of any problems, please contact the author of the script. To improve speed of solving problem first check if script is drawn, and if there is a "!" character after script params. If you can see "!" character, move cursor over it for detail. Send message with error details, ticker and interval to us. The more precise will be your description the faster we will be able to help you.
It finds on the candle chart:
- Existing pattern with realized target in historic data.
- Potencial patterns with realized and potencial targets.
- Estimated patterns that may become potencial with their potencial targets (it updates instantly with the price change (before closing the bar). Such estimation can be confirmed or invalidated in minutes, but can give an advantage and be usefull on higher intervals.
Supports modified traiding patterns:
B.38
B.50
B.618
B.786
B.886
Shark
Cypher
Formation 5-0
Script with limited access, contact author to get authorization
Existing patterns visualization:
Potencial pattern visualization:
On the chart we can see few potencial patterns ( Sharks & Cyphers ). First target of first formation was realized and trend was changed. Chances of reaching targets in each pattern kind we can check by moving mouse over the label. tooltip will show:
- how many patterns are in historical data on this chart
- targets with % of cases in historical data on this chart when target was reached.
WARNING !!!
For each scanner configration and "D point limit" we can get different values. Also numbers of bars (traidingView account type) will change results. You can contact us for details how to optimaze settings for better performance.
Estimated patterns visualization:
On the chart we can see 2 estimated patterns based on current up trend. We can see that trend was already confirmed and will not change in this bar, but "if he had changed" the patterns will be accepted as potencial giving more arguments for move down.
Patterns performance data:
Below we can see chart with stats params set to "%". In the table on right we can see how many patterns were detected on the chart for the current configuration and how many of them reached particular level within the current D limit.
For each scanner configration and "D point limit" we can get different values. Also numbers of bars (traidingView account type) will change results. You can contact us for details how to optimaze settings for better performance.
Script settings:
| XABCD Scanner |
XABC dist limit - Specifies the maximum distance between successive pattern vertex .
Trend type - Specify which wave type should be used.
precision ‰ - It determines the maximum deviations from the conditions that must be met by the patterns. It also causes enlarge / blur of targets.
B.38, B.50, B.618, B.786, B.886, Shark, Cypher, Formation 5-0 - Filter specifying which patterns should be detected and allowing to set pattern color.
| XABCD Scanner Visualization |
You can configure visualziation for each pattern type separatelu:
Existing - Patterns in the historic data
Potencial - Patterns with known XABC vertrex, but without confirmed D.
Estimated - Dynamic patterns with not confirmed C vertex . After extreme formed they can be confirmed or invalidated.
Shape - Check if you want to see pattern shape.
Target - Check if you want to see posibble targets (In case of high precision value, lines become diagonal).
Label - Decide what format should have label. You can pick from: Fullname, shortname, vertical, hidden.
Targets: Filled/Not filled - Allow to change colors used for targets visualization.
Fill: targets/shape - Transparency param of the drawings.
| XABCD Scanner Statistics |
D point limit - A treshold for filter that counts statistics. If D will be reach after passing treshold it will not count as success in the statistics.
over limit color - Color used for patterns line visualization if D is over limit set in previous point.
pattern filter checkbox - Showing dialog with list of potencial patterns.
pattern filter - Field allowing to pick potencial pattern to show.
stats - Shows/hides stats table.
| Trend visualization |
Type - Specify switch what kind of wave should be drawn.
Confirmation - Draw "C" label if wave was confirmed and will not change in this bar. If wave is changing on this bar shows distance from the treshold.
Shadow - Draws second trendline based on the wave extremes.
Low/Mid line width and color - Wave drawing configuration.
| Impuls visualization |
Impuls - Picking graphical reprezentation of first bullish arrow.
Impuls color - Color of the first bullish arrow.
Draw arrow - Drawing arrow on the end of impuls wave.
Troubleshooting:
In case of any problems, please contact the author of the script. To improve speed of solving problem first check if script is drawn, and if there is a "!" character after script params. If you can see "!" character, move cursor over it for detail. Send message with error details, ticker and interval to us. The more precise will be your description the faster we will be able to help you.
リリースノート
Few improvements:- Add stats dedicated for smaller screens.
- Add filter for filled and overlimited potencial formations
リリースノート
Add 0.786 target to Shark formation. リリースノート
Package of fixes:- Drawing formations on bars not waves
- Fix detection of Formation 5-0
リリースノート
Scanner improvements and rename "Cofirmation" into "Alfred" assistentリリースノート
Package of improvements リリースノート
Option to trigger alerts when:- New formation was added
- Take profit 1 price was achieved by formation
- Formation was invalidated (failed)
リリースノート
- Filtering initialy enabled with date: 2022.02.01- Added Leonardo formation
招待専用スクリプト
このスクリプトは作者が承認したユーザーのみアクセス可能です。使用するにはアクセス申請をして許可を得る必要があります。通常は支払い後に承認されます。詳細は下記の作者の指示に従うか、Investor_Rに直接お問い合わせください。
TradingViewは、作者を完全に信頼し、スクリプトの動作を理解していない限り、有料スクリプトの購入・使用を推奨しません。コミュニティスクリプトには無料のオープンソースの代替が多数あります。
作者の指示
Latest instructions always on Youtube and blog page.
To get access, write to inwestor2022@gmail.com
To get access or report problem write on toolkit4trading@proton.me
More details on Website and Youtube.
More details on Website and Youtube.
免責事項
この情報および投稿は、TradingViewが提供または推奨する金融、投資、トレード、その他のアドバイスや推奨を意図するものではなく、それらを構成するものでもありません。詳細は利用規約をご覧ください。