INVITE-ONLY SCRIPT
更新済 Victory Trend with H.A Color
Description of Victory Trend With Heikin Ashi Color's items
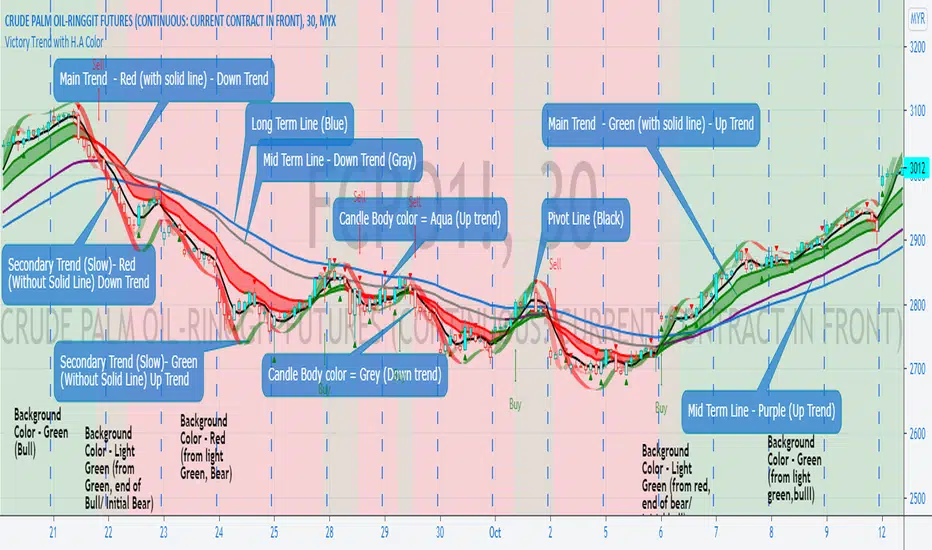
VT Trend With Heikin Ashi Color indicator is formed by Green & Red Main Trend Band, Secondary Band, 4 days HLC Black color line, Mid Term line (Purple & Gray Color Line and Long Term Blue line. Green up arrow with "Buy" text and Red Down Arrow with "sell" text for alert the potential entry chances.
1) Green color Up Trend Main Trend Band with solid line : form by 2 moving average lines and in green color when fast moving average is above slow moving average line
2) Red Color Down Trend Main Trend Band with solid line form by 2 moving average lines and in red color when fast moving average is below slow moving average line
3) Green Up arrow with "buy" text appear : When red color down Trend Main Trend Band with solid line turn from red color to green color, mean potential buy entry
4) Red down arrow with "Sell" text appear : When green color up Trend Main Trend Band with solid line turn from Green color to red color, mean potential Sell entry
5) Black color line = 4 days HLC line
6) Mid term line = Purple color (when up) and gray color (when down)
7) Long term line = Coastal (Light blue) color
8) Stronger Up trend start = When Mid term line cross up Long term line
9) Stronger down trend start = When Mid term line cross down Long term line
10)Background color which represent the Up/down trend and stronger Up/down trend ,
a) lighten Green = Main trend in uptrend but Main trend's slow moving average line haven't cross up mid term line
b) Green =Main trend in uptrend and Main trend's slow moving average line had cross up mid term line
c) lighten Red = Main trend in down trend but Main trend's slow moving average line haven't cross down mid term line
d) Red = Main trend in down trend and Main trend's slow moving average line had cross down mid term line
11) When Up green color triangle appear: mean the candlestick closing price is cross up Black color line (4 days HLC line) & price have potential continue up in short term
When Down Red color triangle appear: mean the candlestick closing price is cross down Black color line (4 days HLC line) & price have potential continue down in short term
12) Green color Up Trend Secondary Trend Band with solid line : form by 2 moving average lines and in green color when fast moving average is above slow moving average line
13) Red Color Down Trend Secondary Trend Band with solid line form by 2 moving average lines and in red color when fast moving average is below slow moving average line
Buy entry strategy No.1:
When Green arrow with "Buy" text appear and wait for the candlestick closed, and enter buy position on next candlestick .
Cut Loss exit: When Main trend turn into red color with Red down Arrow with "sell" text appear.
Target price no.1 : For hold over night. To close position When for Main trend turn into red color band and Red down Arrow with "sell" text appear.
Target price no.2 : For Intraday trade. To close position When price close below the black line
Buy entry strategy No.2:
After green up arrow appear and to add more position when Mid term purple line cross up Long term Blue line.
Cut Loss exit: When Main trend turn into red color with Red down Arrow with "sell" text appear.
Target price no.1 : For hold over night. To close position When for Main trend turn into red color band and Red down Arrow with "sell" text appear.
Target price no.2 : For Intraday trade. To close position When price close below the black line
Sell entry strategy No.1:
When Red arrow with "Sell" text appear and wait for the candlestick closed, and enter sell position on next candlestick .
Cut Loss exit: When Main trend turn into green color with green Up Arrow with "buy" text appear.
Target price no.1 : For hold over night. To close position When for Main trend turn into green color band and green Up Arrow with "Buy" text appear.
Target price no.2 : For Intraday trade. To close position When price close up the black line
Sell entry strategy No.2:
After Red Down arrow appear and to add more position when Mid term Gray color line cross down Long term Blue line.
Cut Loss exit: When Main trend turn into green color with green Up Arrow with "buy" text appear.
Target price no.1 : For hold over night. To close position When for Main trend turn into green color band and green Up Arrow with "Buy" text appear.
Target price no.2 : For Intraday trade. To close position When price close up the black line
"Use the link below to contact Owner for obtain access to this indicator"
リリースノート
To add new item, secondary Trend Slow bandWhen apply together with VT MCDX Smart Money Plus had increases the winning rates for catch the bottom/turning point of the price
"Use the link below to contact Owner for subscribe this indicator"
招待専用スクリプト
このスクリプトは作者が承認したユーザーのみアクセス可能です。使用するにはアクセス申請をして許可を得る必要があります。通常は支払い後に承認されます。詳細は下記の作者の指示に従うか、VTTSに直接お問い合わせください。
TradingViewは、作者を完全に信頼し、スクリプトの動作を理解していない限り、有料スクリプトの購入・使用を推奨しません。コミュニティスクリプトには無料のオープンソースの代替が多数あります。
作者の指示
"Use the link below to contact Owner for subscribe this indicator"
免責事項
この情報および投稿は、TradingViewが提供または推奨する金融、投資、トレード、その他のアドバイスや推奨を意図するものではなく、それらを構成するものでもありません。詳細は利用規約をご覧ください。