OPEN-SOURCE SCRIPT
ES S/R Levels
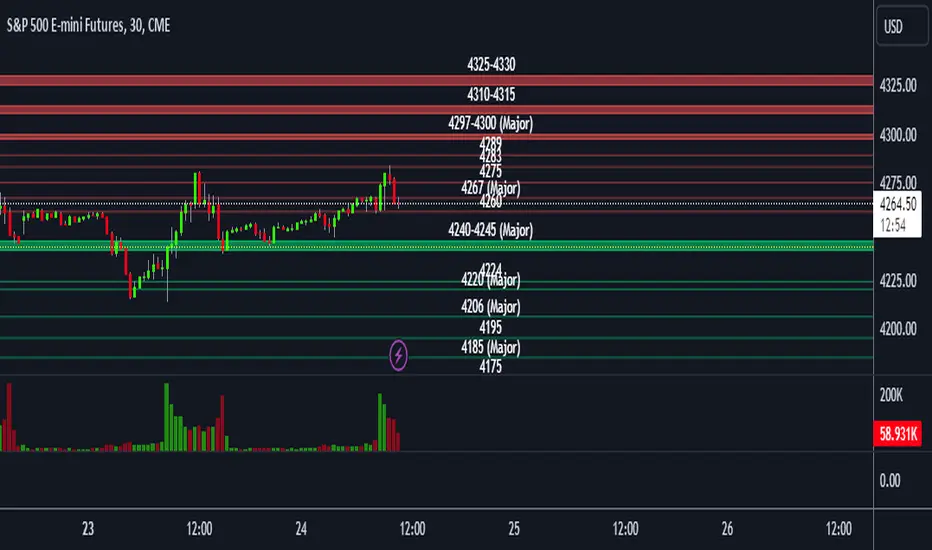
This script plots support and resistance levels for /ES on your chart.
This script only works on the /ES symbol in Tradingview due to the string manipulation of the levels.
You can input support and resistance levels in the inputs.
The example format of S/R levels should be in the following form (comma-separated)
If the level is a single point, it will draw a line. If the level is a range, it will draw a box.
4260, 4267, 4275, 4283, 4289, 4297-4300, 4310-15, 4325-30
You can also add the keyword (major) in your S/R levels input which will add a (Major) label to the drawing
4260, 4267 (major), 4275, 4283, 4289, 4297-4300 (major), 4310-15, 4325-30
オープンソーススクリプト
TradingViewの精神に則り、このスクリプトの作者はコードをオープンソースとして公開してくれました。トレーダーが内容を確認・検証できるようにという配慮です。作者に拍手を送りましょう!無料で利用できますが、コードの再公開はハウスルールに従う必要があります。
免責事項
この情報および投稿は、TradingViewが提供または推奨する金融、投資、トレード、その他のアドバイスや推奨を意図するものではなく、それらを構成するものでもありません。詳細は利用規約をご覧ください。
オープンソーススクリプト
TradingViewの精神に則り、このスクリプトの作者はコードをオープンソースとして公開してくれました。トレーダーが内容を確認・検証できるようにという配慮です。作者に拍手を送りましょう!無料で利用できますが、コードの再公開はハウスルールに従う必要があります。
免責事項
この情報および投稿は、TradingViewが提供または推奨する金融、投資、トレード、その他のアドバイスや推奨を意図するものではなく、それらを構成するものでもありません。詳細は利用規約をご覧ください。