INVITE-ONLY SCRIPT
ATR By Time [Chart]
What is ATR By Time (Chart)?
This premium indicator is a companion script to my ATR By Time indicator.

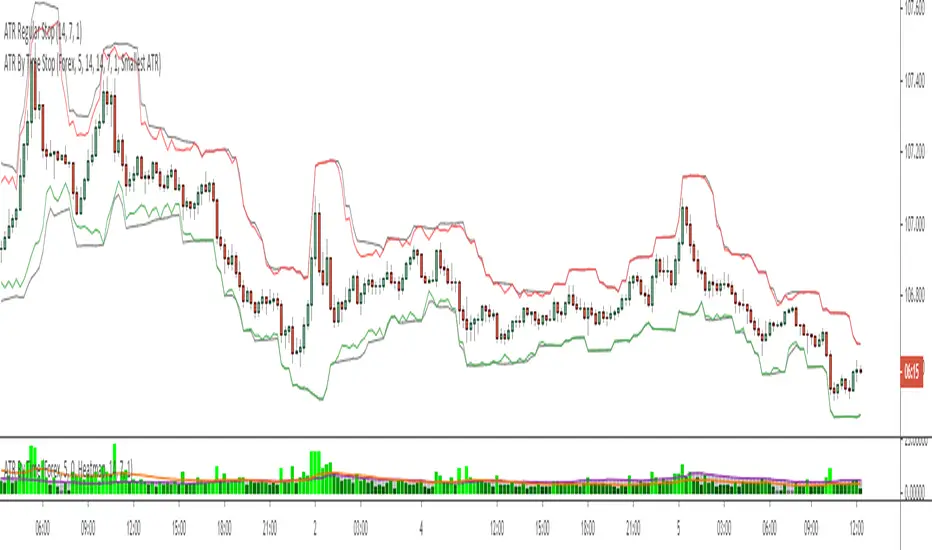
This companion script draws your stop loss price to the chart directly. In the above example, the black line represents a regular 1x ATR stop loss above and below price action, while the colored lines are the 1x ATR By Time indicator values when set to use the "Smallest ATR" in the settings menu.
When set to "Smallest ATR", the script calculates the regular ATR and the ATR By Time of Day and compares the distance of the two values. It then selects whichever value is smaller to be used as the stop loss, and adds or subtracts it to the most recent swing high or low (or the closing price if desired).
This allows for tighter stops and larger position sizing during certain times of day for aggressive traders when set to Smallest ATR, or wider stop losses during more volatile periods of the day for conservative traders when set to Largest ATR.
Stop Loss Distance Options:
- Regular ATR
- ATR By Time
- Smallest ATR
- Largest ATR
More Information
Similar to my RVOL By Time indicator, the ATR By Time indicator works on any market that has consistent trading session lengths. So it works best on Forex & Crypto, but also works on some Stock and Futures markets.
Instead of calculating the ATR based on recent price data like the regular ATR indicator, it calculates an ATR value for each candle based on that candle’s time of day.
For example, if you set the Lookback setting on this indicator to 14, then instead of calculating the ATR based on the past 14 candles, it will calculate an ATR value based on the past 14 trading sessions for each candle (as an average).
So in other words, your 10:00AM candle will show the average of the past 14 10:00AM candles rather than the past 14 candles leading up to that 10:00AM candle.
This is extremely useful for day traders in particular as it allows you to gauge the average range of candles during certain times of day instead of only by the most recent price action.
It also draws a regular ATR (optional) – so this is essentially an enhanced ATR script that gives you multiple readings on price volatility.
If you are interested in trying the script or you want more information on how the script works, there is more information available on my website including instructions on how to apply for a free trial: ATR By Time Feature Page.
Good luck with your trading!
This premium indicator is a companion script to my ATR By Time indicator.
This companion script draws your stop loss price to the chart directly. In the above example, the black line represents a regular 1x ATR stop loss above and below price action, while the colored lines are the 1x ATR By Time indicator values when set to use the "Smallest ATR" in the settings menu.
When set to "Smallest ATR", the script calculates the regular ATR and the ATR By Time of Day and compares the distance of the two values. It then selects whichever value is smaller to be used as the stop loss, and adds or subtracts it to the most recent swing high or low (or the closing price if desired).
This allows for tighter stops and larger position sizing during certain times of day for aggressive traders when set to Smallest ATR, or wider stop losses during more volatile periods of the day for conservative traders when set to Largest ATR.
Stop Loss Distance Options:
- Regular ATR
- ATR By Time
- Smallest ATR
- Largest ATR
More Information
Similar to my RVOL By Time indicator, the ATR By Time indicator works on any market that has consistent trading session lengths. So it works best on Forex & Crypto, but also works on some Stock and Futures markets.
Instead of calculating the ATR based on recent price data like the regular ATR indicator, it calculates an ATR value for each candle based on that candle’s time of day.
For example, if you set the Lookback setting on this indicator to 14, then instead of calculating the ATR based on the past 14 candles, it will calculate an ATR value based on the past 14 trading sessions for each candle (as an average).
So in other words, your 10:00AM candle will show the average of the past 14 10:00AM candles rather than the past 14 candles leading up to that 10:00AM candle.
This is extremely useful for day traders in particular as it allows you to gauge the average range of candles during certain times of day instead of only by the most recent price action.
It also draws a regular ATR (optional) – so this is essentially an enhanced ATR script that gives you multiple readings on price volatility.
If you are interested in trying the script or you want more information on how the script works, there is more information available on my website including instructions on how to apply for a free trial: ATR By Time Feature Page.
Good luck with your trading!
招待専用スクリプト
このスクリプトは作者が承認したユーザーのみアクセス可能です。使用するにはアクセス申請をして許可を得る必要があります。通常は支払い後に承認されます。詳細は下記の作者の指示に従うか、ZenAndTheArtOfTradingに直接お問い合わせください。
TradingViewは、作者を完全に信頼し、スクリプトの動作を理解していない限り、有料スクリプトの購入・使用を推奨しません。コミュニティスクリプトには無料のオープンソースの代替が多数あります。
作者の指示
My Resources Hub: theartoftrading.com
FREE YouTube Lessons: rebrand.ly/zyt
FREE Pine Script Basics Course: rebrand.ly/zpsbc
Pine Script MASTERY Course: rebrand.ly/zpsmc
My Indicators & Strategies: rebrand.ly/zmisc
FREE YouTube Lessons: rebrand.ly/zyt
FREE Pine Script Basics Course: rebrand.ly/zpsbc
Pine Script MASTERY Course: rebrand.ly/zpsmc
My Indicators & Strategies: rebrand.ly/zmisc
免責事項
この情報および投稿は、TradingViewが提供または推奨する金融、投資、トレード、その他のアドバイスや推奨を意図するものではなく、それらを構成するものでもありません。詳細は利用規約をご覧ください。