INVITE-ONLY SCRIPT
更新済 TM_DAY_TRACKER_ADVANCE
Day_Tracker_ Advance Indicator shows overall trend or market direction for Intraday / Swing Position along with Buy or sell signal.
Terminology Use ==> B- Buy, S- Sale Signal, and Numbers are to show time frame indication there is presence of buyer or seller like B1 for buy signal on 1 minute time frame etc.
Display and Interpretation ==>
This indicator help to identify 4 major things:-
1. Area of order Buildup
2. Price Strength
3. Direction
4. Volatility
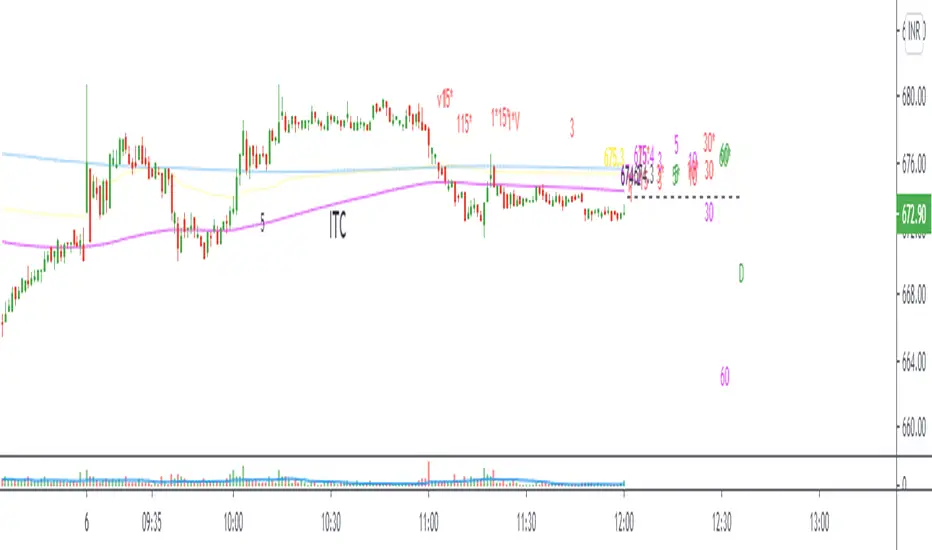
There is 1 dot in chart, This dot show accumulation or distribution price, Green / Red line shows market strength. Signal with 1-3-5-10-15-30-60-D shows active order position over time frame and 1 with Price Value like show area of momentum or volatility . Signal on higher the time frame , more strong momentum
Time frame ==> Use proper Signal with swing trend on 1 minute, 3 minute 5 minute, 15 minute time frame
What to Identify ==> Overall Trend for the intraday and swing Period
How to Use ==>
See how and order buildup is seen and current order position. Also area for volatility and expected movement in price direction
Note: - Use market structure, chart pattern, trend lines and price action parameter for more confirmation.
Entry ==>
Let’s wait the proper area of support or resistance ( Area of Value in case of trend pattern use)
Exit ==>
SL of swing high/low out of market structure with proper risk management and target with proper Risk/ Reward Ratio
Terminology Use ==> B- Buy, S- Sale Signal, and Numbers are to show time frame indication there is presence of buyer or seller like B1 for buy signal on 1 minute time frame etc.
Display and Interpretation ==>
This indicator help to identify 4 major things:-
1. Area of order Buildup
2. Price Strength
3. Direction
4. Volatility
There is 1 dot in chart, This dot show accumulation or distribution price, Green / Red line shows market strength. Signal with 1-3-5-10-15-30-60-D shows active order position over time frame and 1 with Price Value like show area of momentum or volatility . Signal on higher the time frame , more strong momentum
Time frame ==> Use proper Signal with swing trend on 1 minute, 3 minute 5 minute, 15 minute time frame
What to Identify ==> Overall Trend for the intraday and swing Period
How to Use ==>
See how and order buildup is seen and current order position. Also area for volatility and expected movement in price direction
Note: - Use market structure, chart pattern, trend lines and price action parameter for more confirmation.
Entry ==>
Let’s wait the proper area of support or resistance ( Area of Value in case of trend pattern use)
Exit ==>
SL of swing high/low out of market structure with proper risk management and target with proper Risk/ Reward Ratio
リリースノート
Update in Indicator Positionリリースノート
Update in value to .0 digitリリースノート
Update in Levelsリリースノート
Update in Line Valueリリースノート
Update in Line Widthリリースノート
Update in Valuesリリースノート
Update in Valuesリリースノート
Update Valuesリリースノート
Update Valuesリリースノート
Update in Valuesリリースノート
Updatesリリースノート
Updatesリリースノート
Update detailsリリースノート
Updateリリースノート
Updateリリースノート
Updateリリースノート
Update招待専用スクリプト
こちらのスクリプトにアクセスできるのは投稿者が承認したユーザーだけです。投稿者にリクエストして使用許可を得る必要があります。通常の場合、支払い後に許可されます。詳細については、以下、作者の指示をお読みになるか、TradingMind24に直接ご連絡ください。
スクリプトの機能を理解し、その作者を全面的に信頼しているのでなければ、お金を支払ってまでそのスクリプトを利用することをTradingViewとしては「非推奨」としています。コミュニティスクリプトの中で、その代わりとなる無料かつオープンソースのスクリプトを見つけられる可能性もあります。
作者の指示
免責事項
これらの情報および投稿は、TradingViewが提供または保証する金融、投資、取引、またはその他の種類のアドバイスや推奨を意図したものではなく、またそのようなものでもありません。詳しくは利用規約をご覧ください。
招待専用スクリプト
こちらのスクリプトにアクセスできるのは投稿者が承認したユーザーだけです。投稿者にリクエストして使用許可を得る必要があります。通常の場合、支払い後に許可されます。詳細については、以下、作者の指示をお読みになるか、TradingMind24に直接ご連絡ください。
スクリプトの機能を理解し、その作者を全面的に信頼しているのでなければ、お金を支払ってまでそのスクリプトを利用することをTradingViewとしては「非推奨」としています。コミュニティスクリプトの中で、その代わりとなる無料かつオープンソースのスクリプトを見つけられる可能性もあります。
作者の指示
免責事項
これらの情報および投稿は、TradingViewが提供または保証する金融、投資、取引、またはその他の種類のアドバイスや推奨を意図したものではなく、またそのようなものでもありません。詳しくは利用規約をご覧ください。