PROTECTED SOURCE SCRIPT
Reverse DMI
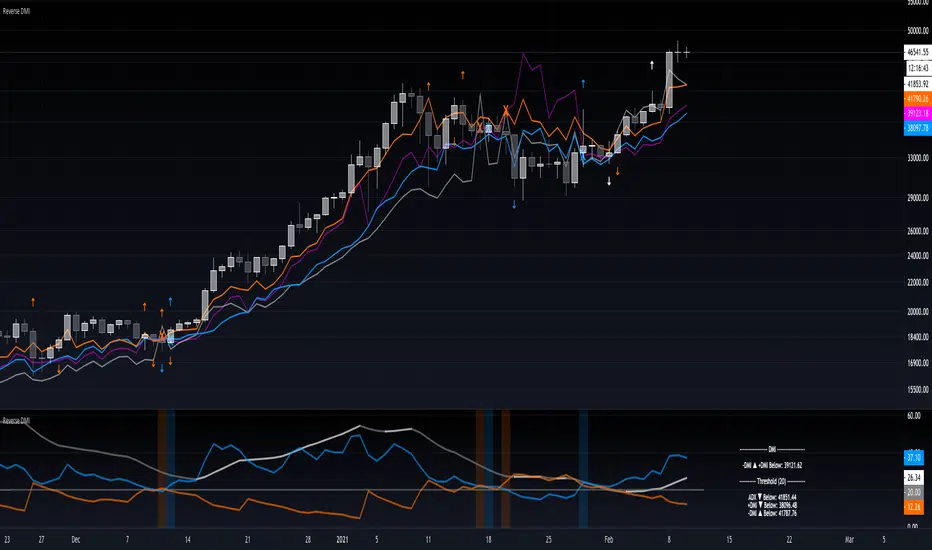
The Reverse DMI is in essence the same DMI or (Directional Movement Index) you all know and love with the addition of two reverse level features, and can be used to assist the end-user in their decision making for entry, exit and risk management.
In a nutshell the first feature is a reverse engineered calculation of the +DMI, and -DMI levels, compared to each other, in relation to the current price level as the point of divergence. The second feature is a reverse engineered calculation of the ADX, +DMI, and -DMI levels, compared to the user defined Threshold level, in relation to the current price level as the point of divergence.
At a glance this can then be used to determine the closing price level needed in order to cross the +DMI and -DMI, as well as the closing price level needed in order to cross the ADX, +DMI, and -DMI either under or over the user defined Threshold.
Optional Settings Include:
-------------------------------
1.) Change the Threshold Levels Right Margin
2.) Show/Hide ADX Exhaustion (will highlight the plot, if condition is met or exceeded)
3.) Show/Hide DMI Crosses (will highlight the background once, if condition is met)
4.) Show/Hide Reverse Levels
5.) Change the Reverse Levels Text Size
6.) Change the Reverse Levels Text Color
7.) Change the Reverse Levels Text Left Margin
8.) Change the Reverse Levels Decimal value
9.) Show/Hide the Reverse Levels Currency
保護スクリプト
このスクリプトのソースコードは非公開で投稿されています。 ただし、制限なく自由に使用できます – 詳細はこちらでご確認ください。
eventview.app
免責事項
この情報および投稿は、TradingViewが提供または推奨する金融、投資、トレード、その他のアドバイスや推奨を意図するものではなく、それらを構成するものでもありません。詳細は利用規約をご覧ください。
免責事項
この情報および投稿は、TradingViewが提供または推奨する金融、投資、トレード、その他のアドバイスや推奨を意図するものではなく、それらを構成するものでもありません。詳細は利用規約をご覧ください。