PROTECTED SOURCE SCRIPT
更新済 ADX & DI with Long + Short Conditions
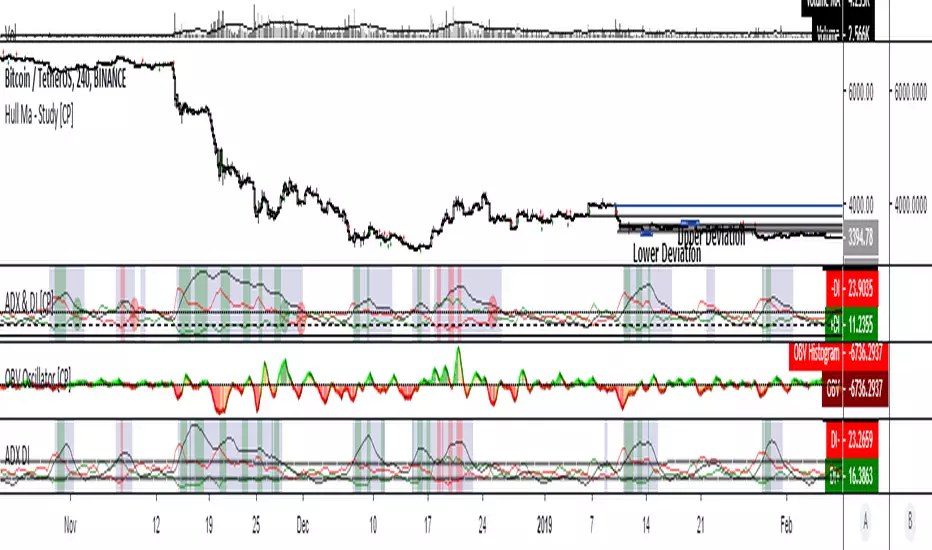
My version of the ADX & DI Indicator with an extra theshold and adjustable long and short conditions.
A green background (long) will appear when the ADX is rising, the DI+ is falling and the DI+ is below the (new) lower threshold.
A red background (short) will appear when the ADX is rising, the DI- is falling and the DI- is below the (new) lower treshold.
You can adjust the tolerance for the lower threshold in the settings of the indicator.
リリースノート
I have made Linear Regression optional and made more settings adjustable (length and offset)Added:
- Heikin Ashi calculations (real ones)
- Visual trade and chop zone via background colors
- Updated settings menu
リリースノート
Added:- ATR calculations on thresholds (1 Hour, 4 Hours or Daily Value)
- Option to change bar color
- Polished up the code a bit
リリースノート
I updated this script to a new version which can be found via clicking the URL below.Unfortunately TradinView does not allow the deletion of old/obsolete scripts
Please use the following version from now on:
Strength & Directional Movement [CP]
保護スクリプト
このスクリプトのソースコードは非公開で投稿されています。 ただし、制限なく自由に使用できます – 詳細はこちらでご確認ください。
免責事項
この情報および投稿は、TradingViewが提供または推奨する金融、投資、トレード、その他のアドバイスや推奨を意図するものではなく、それらを構成するものでもありません。詳細は利用規約をご覧ください。
保護スクリプト
このスクリプトのソースコードは非公開で投稿されています。 ただし、制限なく自由に使用できます – 詳細はこちらでご確認ください。
免責事項
この情報および投稿は、TradingViewが提供または推奨する金融、投資、トレード、その他のアドバイスや推奨を意図するものではなく、それらを構成するものでもありません。詳細は利用規約をご覧ください。