OPEN-SOURCE SCRIPT
更新済 ka66: Swing/Pivot Point Lines
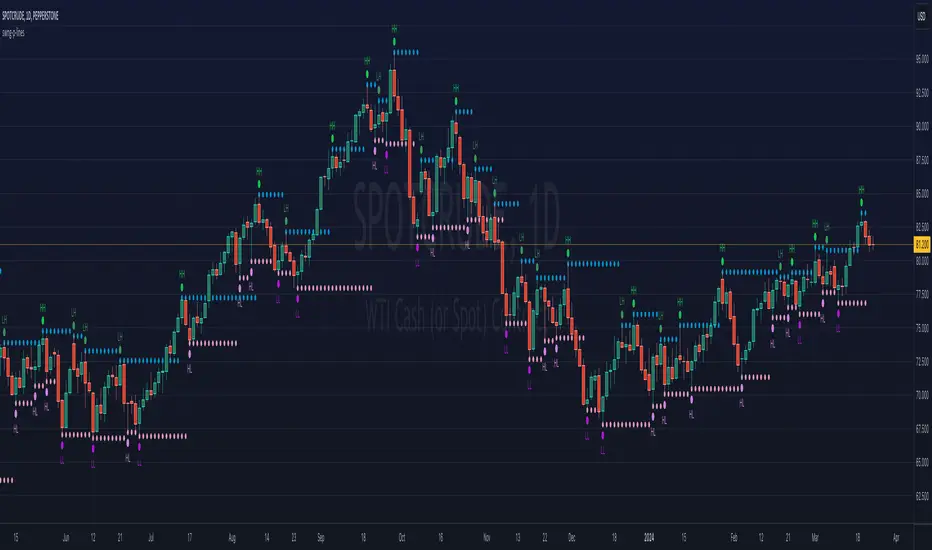
This indicator draws swing-highs and swing-lows, also called pivot highs and lows.
A swing high is a bar which has a higher-high than its surrounding bars (to the left and the right).
A swing low is a bar which has a lower-low than its surrounding bars (to the left and the right).
A common example of a pivot is Bill Williams' Fractal, which specifies that the centre bar must have a higher high than 2 bars to its left, and 2 bars to its right for a swing high, taking into account 5 bars at a time. Similarly, for a swing low, the centre bar must have a lower low than the 2 bars to its left and right.
This indicator allows configurable adjacent bars as input. Entering 2, means it essentially picks out a Williams Fractal. But you can select 1 (say for higher timeframes), using one 1 bar to the left and right of the centre bar.
The indicator will draw Swing/Pivot High/Low as circles at the same price level as the centre bar, till the next one shows up. Drawing is offset so it starts at the centre bar (the swing bar), showing exactly where the pivot bar is.
There are 2 main uses of pivot points, in various strategies:
Messy pivot structures easily point out ranging markets.
There are a few of these, some closed source, which I don't like, since I think people should generally know what they are trading with, and I want to make sure I understand the logic exactly.
A swing high is a bar which has a higher-high than its surrounding bars (to the left and the right).
A swing low is a bar which has a lower-low than its surrounding bars (to the left and the right).
A common example of a pivot is Bill Williams' Fractal, which specifies that the centre bar must have a higher high than 2 bars to its left, and 2 bars to its right for a swing high, taking into account 5 bars at a time. Similarly, for a swing low, the centre bar must have a lower low than the 2 bars to its left and right.
This indicator allows configurable adjacent bars as input. Entering 2, means it essentially picks out a Williams Fractal. But you can select 1 (say for higher timeframes), using one 1 bar to the left and right of the centre bar.
The indicator will draw Swing/Pivot High/Low as circles at the same price level as the centre bar, till the next one shows up. Drawing is offset so it starts at the centre bar (the swing bar), showing exactly where the pivot bar is.
There are 2 main uses of pivot points, in various strategies:
- Market Structure: to objectively define higher-highs/lows and lower-highs/lows in Trend Analysis.
- More generally, to then determine if a trend might reverse, or continue as pivot levels are broken.
Messy pivot structures easily point out ranging markets.
There are a few of these, some closed source, which I don't like, since I think people should generally know what they are trading with, and I want to make sure I understand the logic exactly.
リリースノート
Label relative swing points as per Dow Theory, useful user request:- Higher Highs (HH)
- Higher Lows (HL)
- Lower Highs (LH)
- Lower Lows (LL)
オープンソーススクリプト
TradingViewの精神に則り、このスクリプトの作者はコードをオープンソースとして公開してくれました。トレーダーが内容を確認・検証できるようにという配慮です。作者に拍手を送りましょう!無料で利用できますが、コードの再公開はハウスルールに従う必要があります。
免責事項
この情報および投稿は、TradingViewが提供または推奨する金融、投資、トレード、その他のアドバイスや推奨を意図するものではなく、それらを構成するものでもありません。詳細は利用規約をご覧ください。
オープンソーススクリプト
TradingViewの精神に則り、このスクリプトの作者はコードをオープンソースとして公開してくれました。トレーダーが内容を確認・検証できるようにという配慮です。作者に拍手を送りましょう!無料で利用できますが、コードの再公開はハウスルールに従う必要があります。
免責事項
この情報および投稿は、TradingViewが提供または推奨する金融、投資、トレード、その他のアドバイスや推奨を意図するものではなく、それらを構成するものでもありません。詳細は利用規約をご覧ください。