PROTECTED SOURCE SCRIPT
更新済 FCPO - NSawit Swing Strategy
This Indicator implements a custom strategy function in an indicator script. It works on a 4-hour time frame and exclusively for the FCPO futures market only.
The NSawit Swing Strategy consists of three main features:
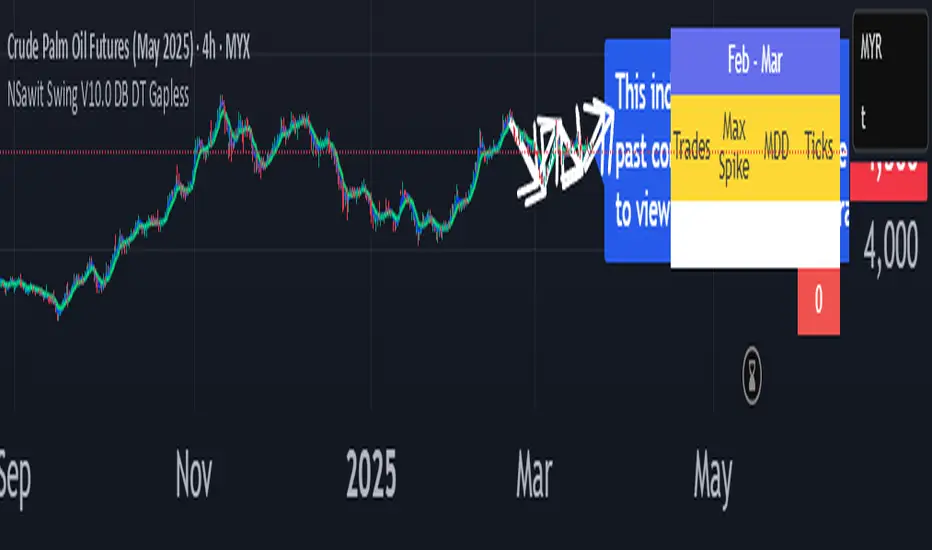
Feature 1: Trade Summary

This feature utilizes the table function to summarize all completed trades within the current active month. The indicator generates a table that displays relevant trade information like total ticks and profit/loss. For example: table.new(position.top_right, 1, 4, border_width=0)
Feature 2: Active Month Highlight

The purpose of this feature is to visually mark the beginning and end of the current active month on the chart. It achieves this by dynamically changing the background color within the current active month. For example: bgcolor(Highlight ? ColorBG : na)
Feature 3: Swing Reversal Points

This feature identifies swing reversal points on the chart by analyzing candlestick patterns and applying a custom matching algorithm.

If a candlestick pattern matches the specified criteria, the indicator generates a retest box area.

When the price touches this box, it triggers long or short orders. The relevant data, including entry and exit points, are stored in sets of arrays. These data are then utilized by the Trade Summary table to provide a comprehensive overview of the swing trading activity.

Take profit and cut loss value can be set in setting.
To view past contracts kindly add this watchlist.
tradingview.com/...atchlists/114756000/
The NSawit Swing Strategy consists of three main features:
Feature 1: Trade Summary
This feature utilizes the table function to summarize all completed trades within the current active month. The indicator generates a table that displays relevant trade information like total ticks and profit/loss. For example: table.new(position.top_right, 1, 4, border_width=0)
Feature 2: Active Month Highlight
The purpose of this feature is to visually mark the beginning and end of the current active month on the chart. It achieves this by dynamically changing the background color within the current active month. For example: bgcolor(Highlight ? ColorBG : na)
Feature 3: Swing Reversal Points
This feature identifies swing reversal points on the chart by analyzing candlestick patterns and applying a custom matching algorithm.
If a candlestick pattern matches the specified criteria, the indicator generates a retest box area.
When the price touches this box, it triggers long or short orders. The relevant data, including entry and exit points, are stored in sets of arrays. These data are then utilized by the Trade Summary table to provide a comprehensive overview of the swing trading activity.
Take profit and cut loss value can be set in setting.
To view past contracts kindly add this watchlist.
tradingview.com/...atchlists/114756000/
リリースノート
Fix the settings menu.リリースノート
Updated watchlisthttps://www.tradingview.com/watchlists/114756000/
リリースノート
Fix tickerID issueリリースノート
Remove tickerID labelリリースノート
* Improve the signal condition.* Restructure summary of trades.
リリースノート
Added new pattern profileリリースノート
*Improve signalリリースノート
Added New Long No 9 & Long No 5.Improve Short No 5 entry point.
リリースノート
8.3リリースノート
Shows low-risk signal based on gapless calculation.リリースノート
Fixed typo All -> Allリリースノート
CL set 16Implement proper arrays
Implement Risk Type in menu
リリースノート
Fix TV tickerID issueリリースノート
Last version. The next version will continue with the strategy script.リリースノート
Fix a lot of pattern issues.保護スクリプト
このスクリプトのソースコードは非公開で投稿されています。 しかし、無料かつ制限なしでご利用いただけます ― 詳細についてはこちらをご覧ください。
免責事項
これらの情報および投稿は、TradingViewが提供または保証する金融、投資、取引、またはその他の種類のアドバイスや推奨を意図したものではなく、またそのようなものでもありません。詳しくは利用規約をご覧ください。
保護スクリプト
このスクリプトのソースコードは非公開で投稿されています。 しかし、無料かつ制限なしでご利用いただけます ― 詳細についてはこちらをご覧ください。
免責事項
これらの情報および投稿は、TradingViewが提供または保証する金融、投資、取引、またはその他の種類のアドバイスや推奨を意図したものではなく、またそのようなものでもありません。詳しくは利用規約をご覧ください。