PROTECTED SOURCE SCRIPT
更新済 Jack Corsellis RS Line
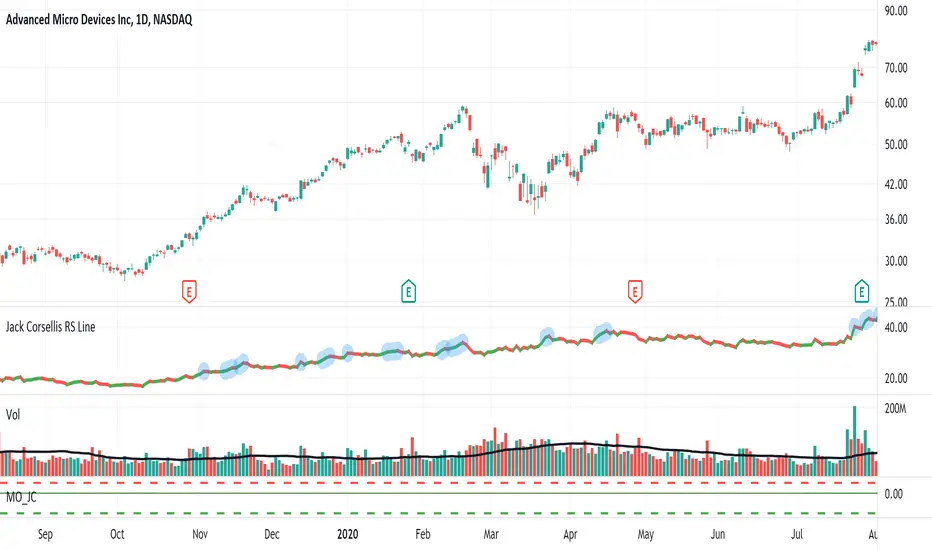
Relative Strength line which shows a blue dot for new 52 week Relative Strength highs.
リリースノート
Jack Corsellis RS Line Rev 1リリースノート
New update.Consistent 52 week blue dot high on daily, weekly and monthly.
No blue dots intraday.
リリースノート
Revisions:1. Added the ability to plot a simple moving average (SMA) of the relative strength line.
This default is OFF (not displayed) and can be toggled ON (displayed) within the options.
The default SMA length is set to 50 days and can be configured within the options.
リリースノート
Updated chart screenshotリリースノート
Updated screenshotリリースノート
Added Red Dot Low on Daily, Weekly and Monthly timeframes. No red dots will be displayed on intraday timeframes.Default look back period for lows is set to 52 weeks.
Indicator settings allow for this period to be configured, visibility of dot to be toggled and appearance to be changed.
保護スクリプト
このスクリプトのソースコードは非公開で投稿されています。 ただし、制限なく自由に使用できます – 詳細はこちらでご確認ください。
免責事項
この情報および投稿は、TradingViewが提供または推奨する金融、投資、トレード、その他のアドバイスや推奨を意図するものではなく、それらを構成するものでもありません。詳細は利用規約をご覧ください。
保護スクリプト
このスクリプトのソースコードは非公開で投稿されています。 ただし、制限なく自由に使用できます – 詳細はこちらでご確認ください。
免責事項
この情報および投稿は、TradingViewが提供または推奨する金融、投資、トレード、その他のアドバイスや推奨を意図するものではなく、それらを構成するものでもありません。詳細は利用規約をご覧ください。