PROTECTED SOURCE SCRIPT
NSE: N50, BN, MIDCAP, FINNIFTY Gainers/Losers Jitendra
Summary of This Indicator
I Have Created This Gainers/Losers dashboard for selected NSE Indices
It is Divided in to symbol groups
1. Nifty Top 39 -High Weight Stocks
2. Nifty Rest 11-Remaining 11 Nifty stocks Low Weightage
3. Bank Nifty,
4. Financial Services,
5. Midcap Select
All Stock Used in Script is As per Latest Data Published by NSE, you can also check buy clicking below link
https://www.niftyindices.com/reports/monthly-reports
Main Features of Indicator
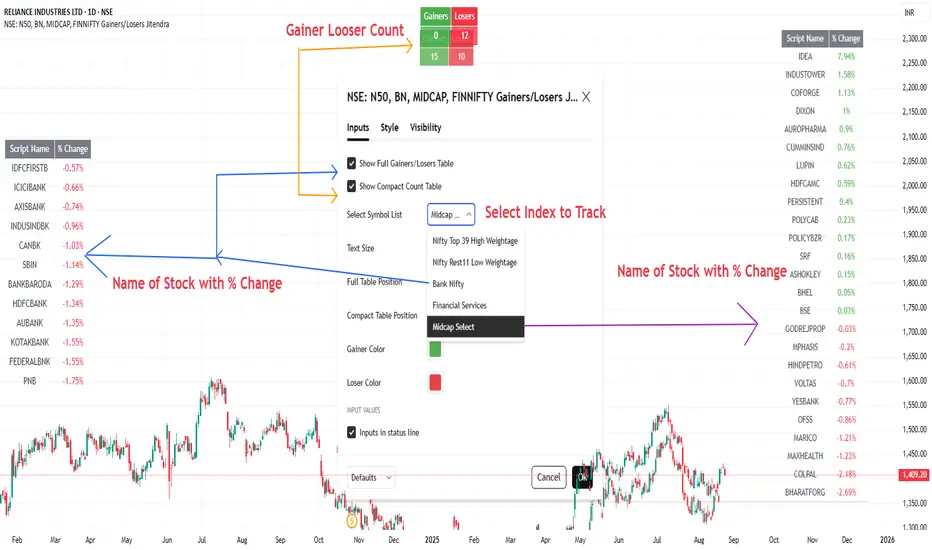
It Has Two Display Modes
Full Table → Shows each stock’s name and its daily % change, sorted from top gainer to top loser.
Compact Count Table → Shows just total number of gainers vs losers.
Customizable Inputs
Data Handling
Outputs
After Selecting Nifty Indices

Data Fetch Command Summary
Symbol Loop & Data Fetch
Pine Script®
Sorting Function (Bubble Sort, Descending by % Change)
Pine Script®
Thanks
I Have Created This Gainers/Losers dashboard for selected NSE Indices
It is Divided in to symbol groups
1. Nifty Top 39 -High Weight Stocks
2. Nifty Rest 11-Remaining 11 Nifty stocks Low Weightage
3. Bank Nifty,
4. Financial Services,
5. Midcap Select
All Stock Used in Script is As per Latest Data Published by NSE, you can also check buy clicking below link
https://www.niftyindices.com/reports/monthly-reports
Main Features of Indicator
It Has Two Display Modes
Full Table → Shows each stock’s name and its daily % change, sorted from top gainer to top loser.
Compact Count Table → Shows just total number of gainers vs losers.
Customizable Inputs
- Choose symbol list (High-weight Nifty, Bank Nifty, etc.).
- Select table size (tiny → large).
- Control table position (Top/Bottom/Middle, Left/Right/Center).
- Customize gainer/loser colors.
- Option to toggle full table or compact table on/off.
Data Handling
- Fetches each stock’s close price vs previous day using request.security().
- Calculates % change for all symbols.
- Uses a bubble sort function to arrange stocks in descending order of % change.
Outputs
- Full Gainers/Losers Table (sorted, detailed).
- Compact Summary Table (just counts).
After Selecting Nifty Indices
Data Fetch Command Summary
Symbol Loop & Data Fetch
for i = 0 to array.size(symbolList)-1
sym = array.get(symbolList, i)
[c, y] = request.security(sym, 'D', [close, close[1]])
chg = na(y) ? na : (c - y) / y * 100
if not na(chg)
array.push(chgList, chg) // store % change
array.push(nameList, sym) // store symbol name
gainers += chg > 0 ? 1 : 0
losers += chg < 0 ? 1 : 0
Sorting Function (Bubble Sort, Descending by % Change)
f_sortDesc(_a, _b) =>
len = array.size(_a)
if len > 1
for i = 0 to len - 2
for j = i + 1 to len - 1
if array.get(_a, j) > array.get(_a, i)
tempVal = array.get(_a, i)
tempSym = array.get(_b, i)
array.set(_a, i, array.get(_a, j))
array.set(_b, i, array.get(_b, j))
array.set(_a, j, tempVal)
array.set(_b, j, tempSym)
Thanks
保護スクリプト
このスクリプトのソースコードは非公開で投稿されています。 ただし、制限なく自由に使用できます – 詳細はこちらでご確認ください。
免責事項
この情報および投稿は、TradingViewが提供または推奨する金融、投資、トレード、その他のアドバイスや推奨を意図するものではなく、それらを構成するものでもありません。詳細は利用規約をご覧ください。
免責事項
この情報および投稿は、TradingViewが提供または推奨する金融、投資、トレード、その他のアドバイスや推奨を意図するものではなく、それらを構成するものでもありません。詳細は利用規約をご覧ください。