INVITE-ONLY SCRIPT
Goldbach Energy Curve
⚡ Goldbach Energy Curve (G-Energy)
Precision phase-energy detection for professional traders
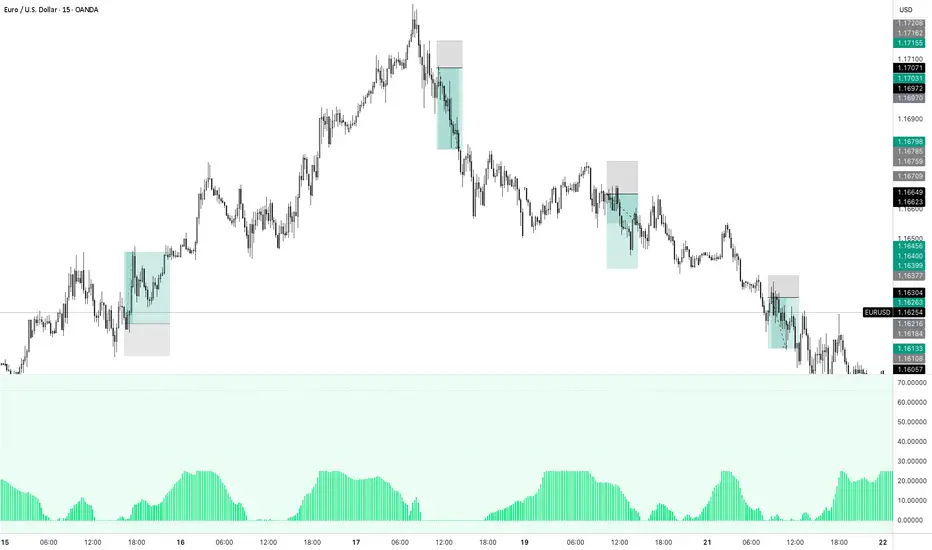
The Goldbach Energy Curve transforms raw market motion into a smooth, color-coded energy profile — revealing when price transitions between Accumulation, Manipulation, and Distribution states.
It blends advanced filtering with adaptive energy mapping to visualize market compression and expansion cycles in real time.
Use it to sense when momentum is building, fading, or rotating across phases — before structure or volume confirms the shift.
⚙️ How to Read the Energy Curve
Below 10 → Ultra-Low Energy Zone
Market in deep Accumulation — liquidity builds, volatility compresses, and smart money positions quietly.
10 – 33 → Rising Accumulation
Early signs of energy release; watch for breakout or expansion setups.
33 – 66 → Manipulation Phase
Transitional zone; expect false moves, liquidity grabs, and short-term volatility spikes.
Above 66 → Distribution Phase
Energy peaks — trend exhaustion, reversals, or large-scale profit-taking often emerge.
Align your directional bias with the market’s current energy state, from silent buildup to full distribution.
Features
Dynamic A / M / D phase tracking
Smooth histogram with adaptive curve overlay
Automatic background shading for instant context
Non-repainting and optimized for multi-timeframe analysis
Ideal for:
Institutional-style traders who value precision, clarity, and early insight into phase rotations.
Precision phase-energy detection for professional traders
The Goldbach Energy Curve transforms raw market motion into a smooth, color-coded energy profile — revealing when price transitions between Accumulation, Manipulation, and Distribution states.
It blends advanced filtering with adaptive energy mapping to visualize market compression and expansion cycles in real time.
Use it to sense when momentum is building, fading, or rotating across phases — before structure or volume confirms the shift.
⚙️ How to Read the Energy Curve
Below 10 → Ultra-Low Energy Zone
Market in deep Accumulation — liquidity builds, volatility compresses, and smart money positions quietly.
10 – 33 → Rising Accumulation
Early signs of energy release; watch for breakout or expansion setups.
33 – 66 → Manipulation Phase
Transitional zone; expect false moves, liquidity grabs, and short-term volatility spikes.
Above 66 → Distribution Phase
Energy peaks — trend exhaustion, reversals, or large-scale profit-taking often emerge.
Align your directional bias with the market’s current energy state, from silent buildup to full distribution.
Features
Dynamic A / M / D phase tracking
Smooth histogram with adaptive curve overlay
Automatic background shading for instant context
Non-repainting and optimized for multi-timeframe analysis
Ideal for:
Institutional-style traders who value precision, clarity, and early insight into phase rotations.
招待専用スクリプト
このスクリプトは作者が承認したユーザーのみアクセス可能です。使用するにはアクセス申請をして許可を得る必要があります。通常は支払い後に承認されます。詳細は下記の作者の指示に従うか、zacdivanに直接お問い合わせください。
TradingViewは、作者を完全に信頼し、スクリプトの動作を理解していない限り、有料スクリプトの購入・使用を推奨しません。コミュニティスクリプトには無料のオープンソースの代替が多数あります。
作者の指示
The Goldbach Energy Curve exposes hidden energy transitions in real time.
Watch how accumulation builds before breakout and distribution forms before reversal.
For exclusive invite access and community updates:https://t.me/zacdivan
免責事項
この情報および投稿は、TradingViewが提供または推奨する金融、投資、トレード、その他のアドバイスや推奨を意図するものではなく、それらを構成するものでもありません。詳細は利用規約をご覧ください。