INVITE-ONLY SCRIPT
更新済 Yearly Weekly Monthly Monday Levels
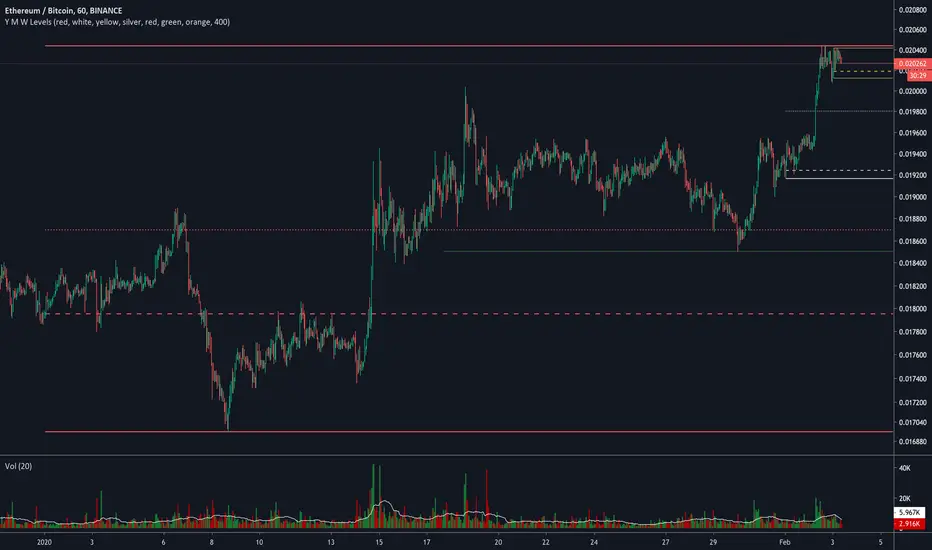
This script displays the Open, High, Low and Mid ranges for Yearly levels, Monthly levels, Weekly levels, and Monday range levels (useful support and resistance levels)
Opens are displayed in dashed lines, and mid-levels in dotted lines. Other lines (highs and lows) are in plain lines.
Colors are selectable (even though color inputs are not still available in Version 4 of TradingView PineScript).
Let me know your username in the comment below if you want to have access.
リリースノート
This new update shows also the Asia range! リリースノート
Updated the code to make it run faster! リリースノート
Updated the code to make it run faster! Each color represent a time horizon:
- Red: Yearly levels
- White: Monthly levels
- Yellow: Weekly levels
招待専用スクリプト
このスクリプトは作者が承認したユーザーのみアクセス可能です。使用するにはアクセス申請をして許可を得る必要があります。通常は支払い後に承認されます。詳細は下記の作者の指示に従うか、idris67に直接お問い合わせください。
TradingViewは、作者を完全に信頼し、スクリプトの動作を理解していない限り、有料スクリプトの購入・使用を推奨しません。コミュニティスクリプトには無料のオープンソースの代替が多数あります。
作者の指示
免責事項
この情報および投稿は、TradingViewが提供または推奨する金融、投資、トレード、その他のアドバイスや推奨を意図するものではなく、それらを構成するものでもありません。詳細は利用規約をご覧ください。