INVITE-ONLY SCRIPT
YK_28CRYPTO_CCI_Custom
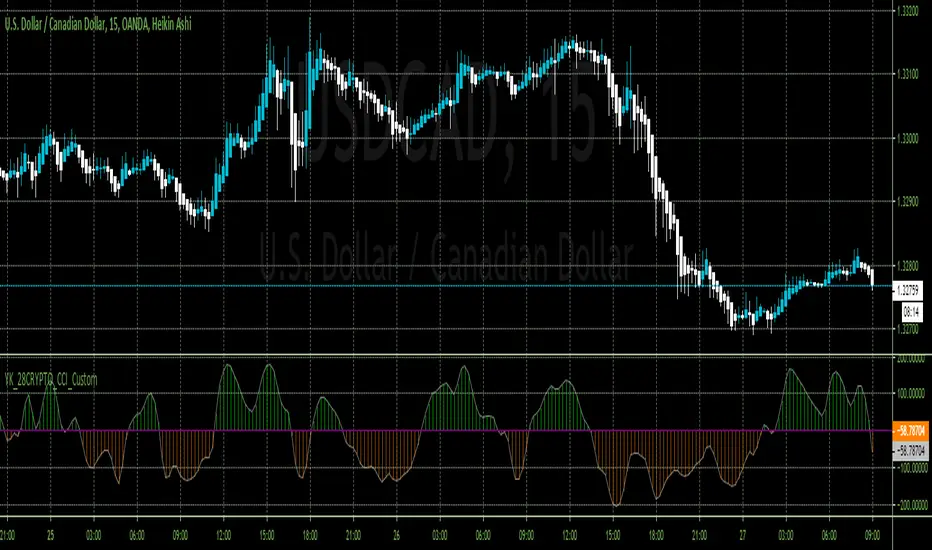
Modified CCI for Heiken Ashi charts
The CCI usually falls in a channel of -100 to 100. The conventional CCI trading system works as follows. When it rises above 100, buy and hold until CCI falls back below 100. When CCI falls below -100, sell short and cover the short when it rises above the -100 line. Some trading systems cover on a rise above minus 85. The following scans represent this strategy.
Buy Signal CCI > 100 AND CCI.1 <= 100
Sell Signal CCI < -100 AND CCI.1 >= -100
A more aggressive use of the CCI indicator dictates entering positions when the index crosses the 0 line. This method helps incorporate the early part of a new move. When the CCI crosses above the 0 line from negative territory, this is a bullish signal. When the CCI crosses below the 0 line from positive territory, this is a bearish signal.
Buy Signal CCI > 0 AND CCI.1 <= 0
Sell Signal CCI < 0 AND CCI.1 >= 0
Modified CCI When "Modified CCI" is checked, the Typical Price is calculated differently, as seen below. Otherwise, the calculations are identical.
TP = (Max(HI,n) + Min(LO,n) + CL) / 3 n = CCI Period TP stands for Typical Price
Also long trades should be supported in combination with RSI going above 40 for Forex and above 50 for Crypto
Same for short trades 40/30 correlated
招待専用スクリプト
このスクリプトは作者が承認したユーザーのみアクセス可能です。使用するにはアクセス申請をして許可を得る必要があります。通常は支払い後に承認されます。詳細は下記の作者の指示に従うか、Seninに直接お問い合わせください。
TradingViewは、作者を完全に信頼し、スクリプトの動作を理解していない限り、有料スクリプトの購入・使用を推奨しません。コミュニティスクリプトには無料のオープンソースの代替が多数あります。
作者の指示
免責事項
この情報および投稿は、TradingViewが提供または推奨する金融、投資、トレード、その他のアドバイスや推奨を意図するものではなく、それらを構成するものでもありません。詳細は利用規約をご覧ください。