PROTECTED SOURCE SCRIPT
Daily % Change Matrix
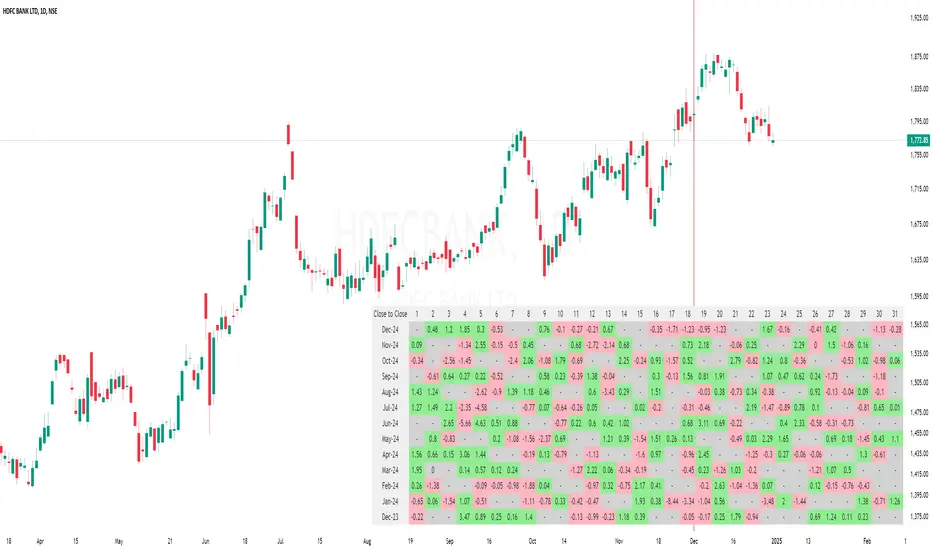
The "Daily % Change Matrix" is a powerful tool designed to visualize daily percentage changes in stock prices. This indicator helps traders analyze trends and volatility over time, enabling data-driven decisions.
Features
Change Calculation Options:
Choose between two methods:
Previous Close to Current Close: Calculates the percent change from the previous day's close to the current day's close.
Open to Close: Calculates the percent change from the current day's open to its close.
Customizable Table Display:
Size Options: Choose between Small, Normal, and Large.
Positioning: Place the table in any corner of the chart (Top Left, Top Right, Bottom Left, or Bottom Right).
Color Coding:
Green: Positive changes.
Red: Negative changes.
Grey: No data or negligible changes.
Table Details
Rows: Days of the month (1-31).
Columns: The last 13 months of data.
Dynamic Header: Automatically updates based on the selected calculation method.
Usage
Change your chart timeframe to Daily (D).
Configure the table's size and position via inputs.
Select the preferred calculation method.
Ideal For
Swing Traders: Identify monthly performance trends.
Analysts: Study long-term patterns across months.
Portfolio Managers: Gain insights into market behavior during specific periods.
Notes
Ensure the timeframe is set to Daily.
Use the table options to adjust for personal preference and chart space.
Contact
For any issues or suggestions, reach out to me.
保護スクリプト
このスクリプトのソースコードは非公開で投稿されています。 ただし、制限なく自由に使用できます – 詳細はこちらでご確認ください。
免責事項
この情報および投稿は、TradingViewが提供または推奨する金融、投資、トレード、その他のアドバイスや推奨を意図するものではなく、それらを構成するものでもありません。詳細は利用規約をご覧ください。
免責事項
この情報および投稿は、TradingViewが提供または推奨する金融、投資、トレード、その他のアドバイスや推奨を意図するものではなく、それらを構成するものでもありません。詳細は利用規約をご覧ください。