INVITE-ONLY SCRIPT
Crypto Money Flow Ratio
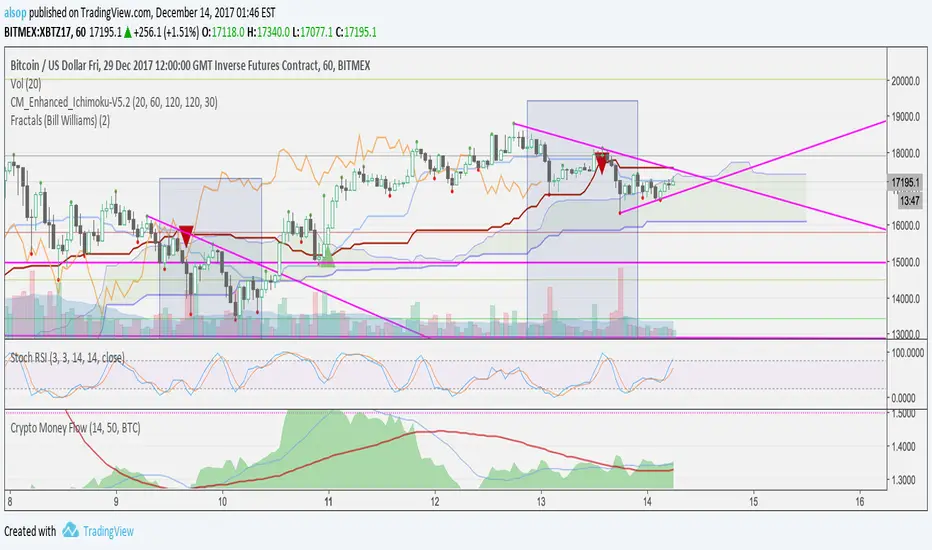
This indicator shows you the movement of buyers and sellers in the market. Combined with other indicators like Stochastic RSI it can be a very powerful early indicator to buy and exit.
In this example, there are two moving averages applied to the indicator (at the bottom). Once the Fast crosses the Slow and the area is above both - this tells you the major market players are accumulating and you should be looking to long.
In addition, Stochastic RSI is also oversold and Ichimoku shows price above the cloud - all confluence on a long trade. As you can see, in the next hour price rocketed.

This size of move isn't always common, and this move may have been due to news. Even if so, people were aware and started buying and you could see it happen.
Another example here with DASH.
In this example, you can see there was a previous bull move that we applied a fib to and had a 38% retracement. We bought on the indicator cross and ratio above averages with a target of a 38% extension. It hit almost exactly and we closed out.

To apply this to other currencies, change the settings. For example, for ETHUSD - change the setting from BTC to ETH.
 BTCUSD
In this example, there are two moving averages applied to the indicator (at the bottom). Once the Fast crosses the Slow and the area is above both - this tells you the major market players are accumulating and you should be looking to long.
In addition, Stochastic RSI is also oversold and Ichimoku shows price above the cloud - all confluence on a long trade. As you can see, in the next hour price rocketed.
This size of move isn't always common, and this move may have been due to news. Even if so, people were aware and started buying and you could see it happen.
Another example here with DASH.
In this example, you can see there was a previous bull move that we applied a fib to and had a 38% retracement. We bought on the indicator cross and ratio above averages with a target of a 38% extension. It hit almost exactly and we closed out.
To apply this to other currencies, change the settings. For example, for ETHUSD - change the setting from BTC to ETH.
招待専用スクリプト
このスクリプトは作者が承認したユーザーのみアクセス可能です。使用するにはアクセス申請をして許可を得る必要があります。通常は支払い後に承認されます。詳細は下記の作者の指示に従うか、alsopに直接お問い合わせください。
TradingViewは、作者を完全に信頼し、スクリプトの動作を理解していない限り、有料スクリプトの購入・使用を推奨しません。コミュニティスクリプトには無料のオープンソースの代替が多数あります。
作者の指示
免責事項
この情報および投稿は、TradingViewが提供または推奨する金融、投資、トレード、その他のアドバイスや推奨を意図するものではなく、それらを構成するものでもありません。詳細は利用規約をご覧ください。