INVITE-ONLY SCRIPT
更新済 Woodies CCI Trading System - Patterns - Strategy Tester
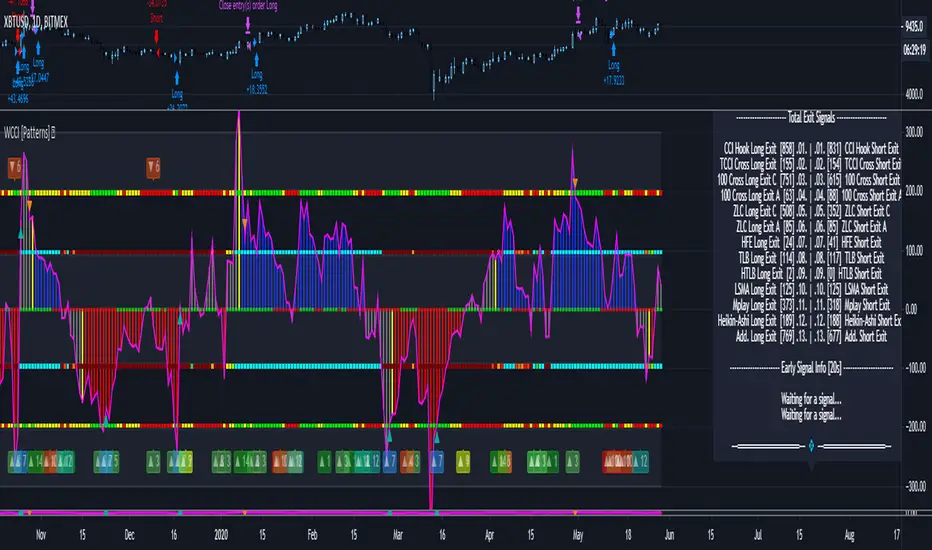
Woodies CCI Trading System - Patterns (Strategy Tester Mode).
The Woodies CCI was initially designed for trading Stocks, Options and the Future Market.
However, different styles of traders can make use of it in various markets and any chart timeframes.
The Woodies CCI Trading System - Patterns takes a Strategy Builder like approach and can be easily configured to scan simultaneously for any available pattern.
The purpose of this tool is to compress everything down to 1 alert to warn of any opportunities, and it can also be automated.
To further improve the success rate, the patterns' performance can be studied with the help of the Strategy Tester.
The Strategy Tester Mode allows for instant backtesting on historical data.
It can assist in determining the right combination of patterns and exit rules, and it can help decide which patterns are better for which market.
The Alert Mode can be found on this page Woodies-CCI Trading System - Patterns (Alert Mode).
This trading system contains all the particular features as described by Woodie, and more.
▪ Pattern Recognition (entry signals based on well-defined patterns)
- Trade patterns that are in agreement with the established trend
1. Zero-Line Reject (ZLR)
2. Trend Line Break (TLB) - with the trend
3. Horizontal Trend Line Break (HTLB) - with the trend
4. Tony Trade (TT)
5. GB100 (GB)
6. Reverse Divergence (RD)
- Trade patterns that are against the trend (these patterns indicate the possibility of a change in trend direction and are recommended for experienced traders)
1. Shamu Trade (ST)
2. The Famir Trade (FT)
3. Vegas Trade (VT)
4. Ghost Trade (GT)
5. Hook From Extreme (HFE)
6. Trend Line Break (TLB) - counter-trend
7. Horizontal Trend Line Break (HTLB) - counter-trend
▪ Exit rules
1. CCI Trend Line Breaks
2. CCI crossing back through the 100 lines
3. TCCI hooking or going flat, not moving, or no progress
4. CCI hook from extremes
5. Profit target hit
6. CCI forming a flat top formation
7. CCI crossing a Horizontal Trend Line
8. When the LSMA disagrees with the trade
9. CCI crossing the Zero-Line (ZL)
▪ WCCI Histogram coloring based on Woodie's trend definition
- Blue for Uptrend
- Red for Downtrend
- Gray for No Trend
- Yellow for trend establishment
▪ The LSMA is on the Zero-Line - it is the 25 period Least Squares Moving Average (it shows the ZL as a series of red and green segments)
- Red segments - the market price is below LSMA
- Green segments - the market price is above LSMA
▪ Chop Zone Indicator (CZI) - Positioned on the levels +100 and -100 (it shows market direction)
- Cyan shows up market
- Brown shows down market
- Multiple colors show market in a sideways mode
▪ Sidewinder Indicator (SI) - Positioned on the levels +200 and -200
- Red shows a flat or non-trending market
- Yellow shows a trending market
- Green shows a strong trending market
▪ The Woodies CCI (14) is indicated with the fuchsia color
▪ WCCI length auto-change to 20 on 1-hour chart intervals and higher
▪ The Turbo CCI (6) has a dark red color
▪ TWCCI auto-hide on 1-hour chart intervals and higher
▪ Early Alert Functionality available (eg 20 seconds before the signal is considered valid)
▪ Simplified Alerts
- An all in one alert
- Alerts for entry triggers
- Alerts for exit conditions
▪ Some Pattern Statistics are available on the chart in a panel
Simple Steps to set it up:
For Beginners:
For the new trader, the trend continuation patterns are easier to manage.
Newcomers should stick to trend-following patterns until they feel very confident!
Here are Three Entry Choices:
Your implicit learned skills are put to the test here. Be fair to yourself and allow yourself time to grow and improve your skills.
You are strongly urged to follow the Option 2.
Related Tools:
The Woodies CCI was initially designed for trading Stocks, Options and the Future Market.
However, different styles of traders can make use of it in various markets and any chart timeframes.
The Woodies CCI Trading System - Patterns takes a Strategy Builder like approach and can be easily configured to scan simultaneously for any available pattern.
The purpose of this tool is to compress everything down to 1 alert to warn of any opportunities, and it can also be automated.
To further improve the success rate, the patterns' performance can be studied with the help of the Strategy Tester.
The Strategy Tester Mode allows for instant backtesting on historical data.
It can assist in determining the right combination of patterns and exit rules, and it can help decide which patterns are better for which market.
The Alert Mode can be found on this page Woodies-CCI Trading System - Patterns (Alert Mode).
This trading system contains all the particular features as described by Woodie, and more.
▪ Pattern Recognition (entry signals based on well-defined patterns)
- Trade patterns that are in agreement with the established trend
1. Zero-Line Reject (ZLR)
2. Trend Line Break (TLB) - with the trend
3. Horizontal Trend Line Break (HTLB) - with the trend
4. Tony Trade (TT)
5. GB100 (GB)
6. Reverse Divergence (RD)
- Trade patterns that are against the trend (these patterns indicate the possibility of a change in trend direction and are recommended for experienced traders)
1. Shamu Trade (ST)
2. The Famir Trade (FT)
3. Vegas Trade (VT)
4. Ghost Trade (GT)
5. Hook From Extreme (HFE)
6. Trend Line Break (TLB) - counter-trend
7. Horizontal Trend Line Break (HTLB) - counter-trend
▪ Exit rules
1. CCI Trend Line Breaks
2. CCI crossing back through the 100 lines
3. TCCI hooking or going flat, not moving, or no progress
4. CCI hook from extremes
5. Profit target hit
6. CCI forming a flat top formation
7. CCI crossing a Horizontal Trend Line
8. When the LSMA disagrees with the trade
9. CCI crossing the Zero-Line (ZL)
▪ WCCI Histogram coloring based on Woodie's trend definition
- Blue for Uptrend
- Red for Downtrend
- Gray for No Trend
- Yellow for trend establishment
▪ The LSMA is on the Zero-Line - it is the 25 period Least Squares Moving Average (it shows the ZL as a series of red and green segments)
- Red segments - the market price is below LSMA
- Green segments - the market price is above LSMA
▪ Chop Zone Indicator (CZI) - Positioned on the levels +100 and -100 (it shows market direction)
- Cyan shows up market
- Brown shows down market
- Multiple colors show market in a sideways mode
▪ Sidewinder Indicator (SI) - Positioned on the levels +200 and -200
- Red shows a flat or non-trending market
- Yellow shows a trending market
- Green shows a strong trending market
▪ The Woodies CCI (14) is indicated with the fuchsia color
▪ WCCI length auto-change to 20 on 1-hour chart intervals and higher
▪ The Turbo CCI (6) has a dark red color
▪ TWCCI auto-hide on 1-hour chart intervals and higher
▪ Early Alert Functionality available (eg 20 seconds before the signal is considered valid)
▪ Simplified Alerts
- An all in one alert
- Alerts for entry triggers
- Alerts for exit conditions
▪ Some Pattern Statistics are available on the chart in a panel
Simple Steps to set it up:
- 1 - Choose at least 1 pattern (with-the-trend patterns are friendlier than the counter-trend ones)
- 2 - Choose at least 1 exit condition
- 3 - Set the alerts (1 for Entry and 1 for Exit, or 1 alert running for both Entry and Exit)
For Beginners:
For the new trader, the trend continuation patterns are easier to manage.
Newcomers should stick to trend-following patterns until they feel very confident!
Here are Three Entry Choices:
- 1 - Conservative -
Wait until the bar closes to enter - This is the easiest to execute. - 2 - Conservative to Aggressive -
Woodie would like the beginner to enter the market if, with 20 seconds left in the bar, a valid CCI pattern presents itself. - 3 - Very Aggressive -
Enter trade as soon as the bar indicates a signal during price bar formation. This is for experienced traders, as the signal conditions are final at the close of the bar and the intra-bar changes are not recorded.
Your implicit learned skills are put to the test here. Be fair to yourself and allow yourself time to grow and improve your skills.
You are strongly urged to follow the Option 2.
- Money Management: Apply an Initial Protective Stop; Use Trade Exits; Study the past performance - Statistics (Strategy Tester Mode).
Related Tools:
- Woodies-CCI Trading System - Patterns - Alerts
- Risk Management System (Stop Loss, Take Profit, Trailing Stop Loss, Trailing Take Profit) - it can be connected to the Woodies-CCI Trading System - Patterns - Alerts
- Early/Delayed Signal Explained
リリースノート
fixed an error appearing on low timeframesリリースノート
- performance improvements招待専用スクリプト
このスクリプトは作者が承認したユーザーのみアクセス可能です。使用するにはアクセス申請をして許可を得る必要があります。通常は支払い後に承認されます。詳細は下記の作者の指示に従うか、KryptoNightに直接お問い合わせください。
TradingViewは、作者を完全に信頼し、スクリプトの動作を理解していない限り、有料スクリプトの購入・使用を推奨しません。コミュニティスクリプトには無料のオープンソースの代替が多数あります。
作者の指示
Join the Discord Server for more info about the published tools.
discord.io/CryptoWorld
a Discord bot for Charting (TradingView and Heatmaps) is available
🟣 If you like any of my Invite-Only Tools, let me know
(DM or Discord for inquiries)
discord.io/CryptoWorld
a Discord bot for Charting (TradingView and Heatmaps) is available
🟣 If you like any of my Invite-Only Tools, let me know
(DM or Discord for inquiries)
免責事項
この情報および投稿は、TradingViewが提供または推奨する金融、投資、トレード、その他のアドバイスや推奨を意図するものではなく、それらを構成するものでもありません。詳細は利用規約をご覧ください。
招待専用スクリプト
このスクリプトは作者が承認したユーザーのみアクセス可能です。使用するにはアクセス申請をして許可を得る必要があります。通常は支払い後に承認されます。詳細は下記の作者の指示に従うか、KryptoNightに直接お問い合わせください。
TradingViewは、作者を完全に信頼し、スクリプトの動作を理解していない限り、有料スクリプトの購入・使用を推奨しません。コミュニティスクリプトには無料のオープンソースの代替が多数あります。
作者の指示
Join the Discord Server for more info about the published tools.
discord.io/CryptoWorld
a Discord bot for Charting (TradingView and Heatmaps) is available
🟣 If you like any of my Invite-Only Tools, let me know
(DM or Discord for inquiries)
discord.io/CryptoWorld
a Discord bot for Charting (TradingView and Heatmaps) is available
🟣 If you like any of my Invite-Only Tools, let me know
(DM or Discord for inquiries)
免責事項
この情報および投稿は、TradingViewが提供または推奨する金融、投資、トレード、その他のアドバイスや推奨を意図するものではなく、それらを構成するものでもありません。詳細は利用規約をご覧ください。