INVITE-ONLY SCRIPT
RSI MACD CLOCKWORK TABLE
What you get, at a glance:
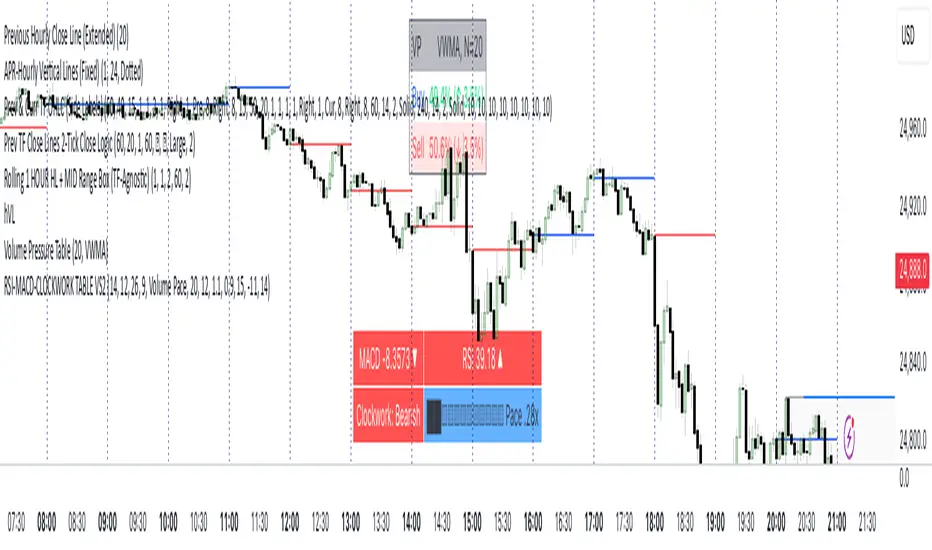
• MACD Cell — Shows the current MACD value and a small direction icon (▲ rising, ▼ falling, ⏺ flat). The background color adapts to regime: green above zero, red below zero, gray near the line. Lengths are configurable (fast/slow/signal).
• RSI Cell — Plots the latest RSI with an identical direction icon and background logic (green above 50, red below 50, gray around 50). RSI length is configurable.
• Clockwork Row — This is the structure check. The script computes the slope (in degrees) of EMA(5), EMA(8), and EMA(13). If all three exceed your bullish threshold, you’ll see “Clockwork: Bullish” (lime). If all three are below your bearish threshold, you’ll see “Clockwork: Bearish” (red). Otherwise, it’s “Neutral” (gray). Thresholds are fully user-tunable.
Smart right-hand cell (choose your readout):
• Duplicate — Mirrors the Clockwork label.
• Time to Close — A clean mm:ss countdown for the current timeframe (with safe defaults on unusual timeframes).
• Slope Degrees — Prints the 5/8/13 EMA slopes in degrees (e.g., +12.3°).
• Slope Pack ▲▼ — Only the direction of each slope (less noise, more speed).
• EMA Spread (5↔13) — Shows the slope differential (degrees) between short and long EMAs.
• Volume Pace — Projects end-of-bar volume from live progress, compares it to your N-bar average, and renders a tiny text progress bar (██░░…) with a neutral “thermo” palette: black = hot (> high threshold), light blue = cold (< low threshold), silver = typical. All inputs (length, bar width, thresholds) are configurable.
• ATR — Current ATR with direction vs previous bar (▲/▼/⏺).
Quality-of-life:
• Optional top padding (~20px) to keep the table visually separated from other overlays.
• Lightweight string/emoji UI for clarity without heavy graphics.
• Defensive guards around timeframe math so the TTC keeps working smoothly.
How to use:
Add to any symbol/timeframe.
Set your MACD/RSI lengths and Clockwork slope thresholds to match your system’s sensitivity.
Pick a right-cell mode that complements your workflow (TTC for day trading, Volume Pace for intrabar context, ATR for volatility).
Note: This tool is informational, not a standalone signal generator. Combine the Clockwork alignment with your entries/exits and risk management.
招待専用スクリプト
このスクリプトは作者が承認したユーザーのみアクセス可能です。使用するにはアクセス申請をして許可を得る必要があります。通常は支払い後に承認されます。詳細は下記の作者の指示に従うか、EliteTradingIndicatorsに直接お問い合わせください。
TradingViewは、作者を完全に信頼し、スクリプトの動作を理解していない限り、有料スクリプトの購入・使用を推奨しません。コミュニティスクリプトには無料のオープンソースの代替が多数あります。
作者の指示
RSI-MACD-CLOCKWORK TABLE VS2 is a compact, no-nonsense dashboard that sits on your main chart and keeps three pillars of momentum/structure in view: MACD, RSI, and a “Clockwork” slope alignment check across EMAs.
免責事項
この情報および投稿は、TradingViewが提供または推奨する金融、投資、トレード、その他のアドバイスや推奨を意図するものではなく、それらを構成するものでもありません。詳細は利用規約をご覧ください。