PROTECTED SOURCE SCRIPT
Candle Range in Ticks / Pips
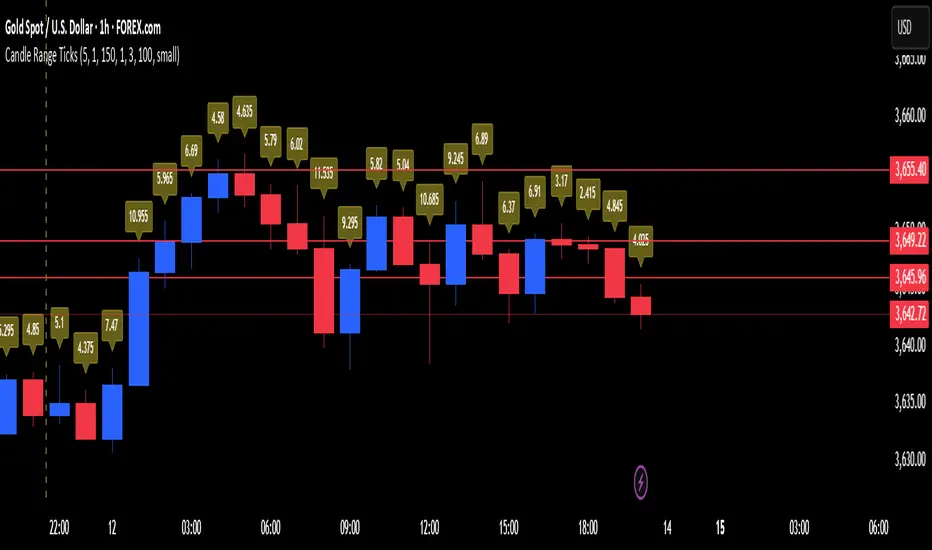
This indicator displays the size (range) of each candle in ticks, pips, or points. Labels are drawn above or below each candle with full customization, so you can quickly spot volatility shifts and unusual ranges.
Features:
- Show candle ranges for the last days (configurable)
- Custom point-to-tick/pip ratio for different markets (Forex, Futures, Indices, Crypto)
- Choose label size, color, and placement (above or below candles)
- Control how dense labels are with an “every Nth candle” option
- Built-in safeguard with a max label limit to keep charts smooth
Use cases:
- Quickly measure and compare candle ranges across sessions or days
- Spot unusually large or small candles relative to recent activity
- Analyze volatility in ticks/pips without switching to a separate tool
保護スクリプト
このスクリプトのソースコードは非公開で投稿されています。 ただし、制限なく自由に使用できます – 詳細はこちらでご確認ください。
免責事項
この情報および投稿は、TradingViewが提供または推奨する金融、投資、トレード、その他のアドバイスや推奨を意図するものではなく、それらを構成するものでもありません。詳細は利用規約をご覧ください。
保護スクリプト
このスクリプトのソースコードは非公開で投稿されています。 ただし、制限なく自由に使用できます – 詳細はこちらでご確認ください。
免責事項
この情報および投稿は、TradingViewが提供または推奨する金融、投資、トレード、その他のアドバイスや推奨を意図するものではなく、それらを構成するものでもありません。詳細は利用規約をご覧ください。