(VIP) VSA Scanner v2
All major signals from VSA have been added like Stopping Volume, Climaxes, End of Rising Market, Bag Holding etc.
In case of interest, please contact me directly via DM on Tradingview or please see link to documentation from my signature where you can find more information about Subscription and script itself.
- Corrected and updated definitions of signals accordingly to the most recent rules of VSA methodology
- Optimised performance of calculations
- Added new VSA Signals
- Bugfixes
- corrected few signals definition and classification in SOW
- adjusted alerts to reflect the newest bugfixes
- new function - Volume-based S/R levels
- added display of EMA200
- Added option to display auto-adaptive Hull Moving Average based on Range or Volume present on the market
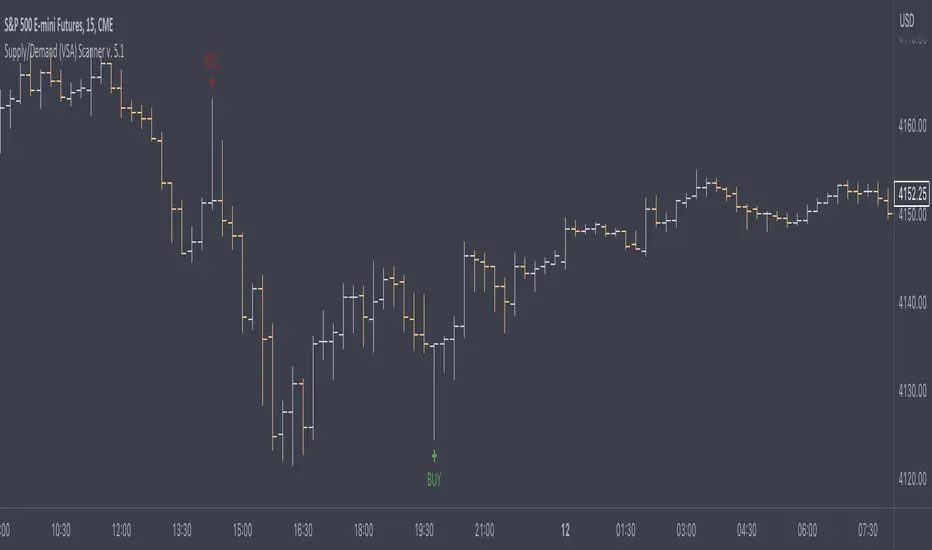
There are four categories of signals now marked as below:
- Cross and Diamond - major signals predicting possible trend reversal
- Circle - Signals of Weakness/Strength
- Triangle - Tests from VSA methodology
- Flag - is displaying signals when Supply/Demand Zone were broken
Ideal scenario would be to get firsty Cross or Diamond Signal, then Circle and Triangle - but it's not always happening. It's individual judgement of trader what makes a difference and can turn signals from VSA Scanner into profitable trade.
There are also drawn Supply (orange) and Demand Zones (blue).
Scanner is not displaying all Wyckoff's nor VSA signals in order to simplify things but I tried to reflect as much as possible in it - that's why we have also Strength and Weakness Signals or Confirmations being displayed on chart.
Bullish - Green, Blue, Purple
Bearish - Red, Orange, Yellow
Also I've added logic to limit double signals per bars, introducing priority of signals policy and display more important signal per bar in case of multiple signals identified by algo
- corrected definitions of signals from VSA & Wyckoff methodology, improved accuracy
- added functionality of display Ultra Zones, extremely accurate in trading in case of retests/breakthroughs
- Alerts added
- Adjusted signals accuracy, corrections in definitions
- Bugfixes
- added alternative method of trend calculation (recommended and enabled by default)
- ultra volume zones are more accurate than even before! Now they're combined strictly with Climactic VSA Signals and Ultra high Volume Levels (you still have possibility to enable display of all volume zones based on vsa)
- alerts added
- simplification of signals display - now it's either BUY or SELL in default mode
- code migration to Pine v5
招待専用スクリプト
このスクリプトにアクセスできるのは作者から許可されたユーザーに限られており、通常は支払いが必要になります。スクリプトをお気に入りに追加することはできますが、使用するにはその作者に許可を申請し、その許可を得る必要があります ― 詳細についてはこちらをご覧ください。さらに詳しい情報が必要な場合は下記の作成者からの手引きをご覧になるか、skyline-traderに直接お問い合わせください。
スクリプトの機能を理解し、その作者を全面的に信頼しているのでなければ、お金を支払ってまでそのスクリプトを利用することをTradingViewとしては「非推奨」としています。コミュニティスクリプトの中で、その代わりとなる無料かつオープンソースのスクリプトを見つけられる可能性もあります。
作者の指示
警告: 招待専用スクリプトへのアクセスをリクエストする前に弊社のガイドをお読みください。
免責事項
招待専用スクリプト
このスクリプトにアクセスできるのは作者から許可されたユーザーに限られており、通常は支払いが必要になります。スクリプトをお気に入りに追加することはできますが、使用するにはその作者に許可を申請し、その許可を得る必要があります ― 詳細についてはこちらをご覧ください。さらに詳しい情報が必要な場合は下記の作成者からの手引きをご覧になるか、skyline-traderに直接お問い合わせください。
スクリプトの機能を理解し、その作者を全面的に信頼しているのでなければ、お金を支払ってまでそのスクリプトを利用することをTradingViewとしては「非推奨」としています。コミュニティスクリプトの中で、その代わりとなる無料かつオープンソースのスクリプトを見つけられる可能性もあります。
作者の指示
警告: 招待専用スクリプトへのアクセスをリクエストする前に弊社のガイドをお読みください。