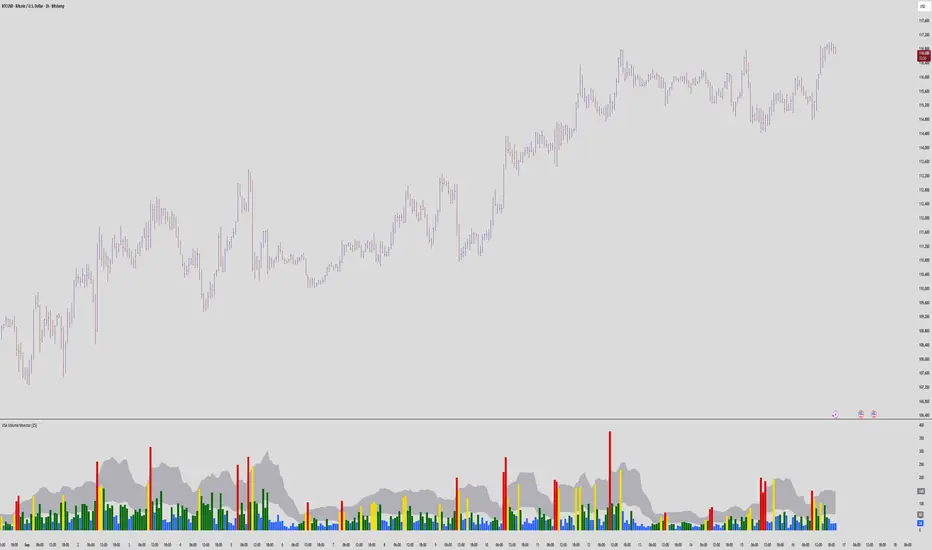
Effort vs Result Reaction Map [AGPro Series]Effort vs Result Reaction Map
⚖️ OVERVIEW
Effort vs Result Reaction Map is a premium volume-price reaction indicator built around one of the most practical ideas from Wyckoff and Volume Spread Analysis: effort only matters when it is compared with result.
Many volume tools stop at identifying high volume, relative volume spikes, wide candles or bullish/bearish pressure. This script goes further by asking a more selective question:
Is the market actually getting progress for the effort being spent?
The indicator compares normalized participation effort, ATR-adjusted price progress, close-location quality, directional efficiency and wick behavior. The output is a clean reaction map that highlights two specific event families:
• High effort + poor result
• Low effort + strong result
That makes the script different from a simple volume spike detector, a generic pressure map, a support/resistance drawer or a full Wyckoff phase tool. It is focused on the moment where participation and progress become meaningfully disconnected.
🔬 CORE IDEA
Effort is built from two dimensions:
• Relative volume versus a rolling participation baseline
• Candle spread normalized by ATR
Result is built from:
• Price progress over a configurable number of bars
• Close-location quality in the direction of progress
• ATR-normalized movement quality
Efficiency measures the relationship between those two sides. A bar can show strong volume, but if price does not achieve directional progress, the script treats that as a potential failed-progress reaction. A bar can also move cleanly with surprisingly low effort, which can reveal ease of movement and directional acceptance.
🧭 WHAT MAKES IT DIFFERENT
Most public volume indicators answer one of these questions:
• Is volume high?
• Is relative volume expanding?
• Is price near a volume shelf?
• Is pressure bullish or bearish?
• Is a Wyckoff phase forming?
Effort vs Result Reaction Map answers a narrower and more actionable chart-reading question:
Did the market receive enough result for the effort it spent?
This keeps the tool focused and prevents it from overlapping with broader volume profile, relative volume, delta, session reaction or support/resistance scripts. It does not try to label accumulation, distribution, spring, upthrust or phase structure. Instead, it turns effort/result imbalance into a compact reaction framework that can sit cleanly on any chart.
🎯 SIGNAL TYPES
High Effort + Poor Result
This event appears when participation and spread are unusually active but price progress remains weak. The script studies wick behavior and candle direction to estimate which side attempted progress and failed. The label then expresses the opposite reaction bias:
• Failed Bull Progress
• Failed Bear Progress
Low Effort + Strong Result
This event appears when price makes strong directional progress while effort remains unusually light. This can suggest ease of movement, cleaner directional travel or a lack of opposing participation in that moment:
• Low Effort Rise
• Low Effort Drop
Each event must pass a confidence threshold and a visual cooldown before it appears on the chart. This keeps the output selective and suitable for publication-quality screenshots.
🟦 REACTION BOXES
The script can draw rectangular reaction boxes around qualified events. These boxes are not generic support and resistance zones. They are event-native reaction ranges created only when the effort/result engine finds a meaningful imbalance.
Reaction boxes help the user track whether the market later respects, revisits or ignores the area where effort and result became disconnected. The box length, padding, transparency and minimum confidence are configurable.
This gives the chart more structure without turning the indicator into another broad zone tool.
📊 PANEL
The compact panel reports:
• Effort
• Result
• Efficiency
• Reaction Bias
• Confidence
The first panel row follows the AGPro standard format: one merged blue header row containing only the script name. Panel location, panel theme and panel font size are all configurable from the settings.
⚙️ KEY SETTINGS
Engine
• Effort Baseline Length controls the volume normalization baseline.
• ATR Normalization Length controls spread, progress and object spacing.
• Result Progress Bars defines how far back the result comparison looks.
• Volume Weight In Effort balances relative volume versus candle spread.
Reaction Thresholds
• High Effort Threshold defines unusual participation.
• Low Effort Threshold defines unusually light participation.
• Poor Result Threshold filters failed-progress events.
• Strong Result Threshold filters low-effort strong-result events.
• Minimum Event Confidence controls final event selectivity.
• Visual Cooldown Bars keeps labels and boxes from clustering.
Reaction Boxes
• Box Minimum Confidence keeps boxes more selective than labels if desired.
• Box Extend Right Bars controls how long reaction ranges remain visible.
• Box ATR Padding gives boxes a clean margin around the event candle.
• Box Transparency controls chart softness.
Labels And Markers
• Event labels can be enabled or disabled.
• Label confidence can be shown or hidden; it is hidden by default for cleaner screenshots.
• Label font size defaults to Normal.
• Label offset uses ATR so labels stay away from candle bodies.
• Directional markers provide a minimal visual cue for qualified reactions.
🧠 HOW TO USE
Apply the script to a liquid market and start with the default settings.
Watch for high-effort poor-result labels when volume and spread expand but the market fails to make clean progress. These areas can be useful for studying absorption, failed pushes and short-term reaction shifts.
Watch for low-effort strong-result labels when price moves cleanly without requiring heavy participation. These events can help identify easier directional travel and cleaner movement conditions.
Use the reaction boxes as context zones created by the event itself. They are best read together with structure, trend context, liquidity areas, session behavior or your own discretionary framework.
✅ BEST USE CASES
• Spotting failed directional progress after heavy participation
• Comparing volume effort with actual price result
• Identifying clean movement when result expands on lighter effort
• Studying short-term absorption and efficiency shifts
• Adding Wyckoff/VSA-inspired logic without using a full phase detector
• Keeping a premium chart layout with selective labels and contextual boxes
🧩 LIMITATIONS AND TRANSPARENCY
Effort vs Result Reaction Map is an analytical indicator, not a strategy.
It does not classify full Wyckoff phases, does not draw generic support/resistance, and does not attempt to forecast future price. Its purpose is to organize observed effort/result behavior into a clean visual framework.
Event quality depends on symbol behavior, timeframe, volume reliability and selected thresholds. Markets with unreliable volume data may need more conservative settings.
The script is designed to be selective by default, but users can tune thresholds, confidence, cooldown, label size, panel theme and reaction box visibility to match their preferred chart style.
インジケーター

Volume Climax Detector [AGPro Series]Volume Climax Detector
Volume Climax Detector is an advanced volume analytics tool that identifies extreme institutional volume events using a three-filter VSA (Volume Spread Analysis) methodology. Rather than triggering on simple volume multiples, the script combines Volume Z-Score statistics, Spread analysis, and Close Location to isolate genuine climax bars — the kind of exhaustion moves Wyckoff and VSA traders look for at trend tops and bottoms.
🔹 OVERVIEW
Volume alone is a noisy signal. A "high volume bar" on one instrument is a quiet bar on another, and most volume-based indicators either miss real climaxes or fire on every uptick. This script takes a statistical approach: it measures how extreme each bar's volume is relative to its own recent history (Z-Score), confirms the bar structure makes sense (Spread and Close Location), and then classifies the event as a Buying Climax or Selling Climax using trend context — the Wyckoff way.
The result is a small number of high-conviction labels at exactly the places where large participants tend to exhaust themselves: panic buys at tops, panic sells at bottoms, and hidden absorption in between.
🔹 WHAT MAKES IT DIFFERENT
Most volume indicators apply a single threshold (e.g. volume > 2× average) and stop there. This script layers three independent VSA filters, each addressing a different failure mode:
• Volume Z-Score — adapts to the instrument's own volume distribution. A 3σ event on BTC is genuinely rare, regardless of session or timeframe.
• Spread filter — requires the bar's range to exceed its recent average. Eliminates the common false positive of a high-volume bar that barely moved (compression).
• Close Location — requires the close to sit in the upper or lower third of the bar. Separates conviction from indecision.
Beyond detection, two analytics layers set it apart from typical volume tools:
• Reversal Success Tracking — every climax is tracked forward for a configurable window, and the script records whether a meaningful counter-move actually materialised (measured in ATR). The panel shows a live Reversal Rate, so users get honest feedback on how well climaxes have worked on the current symbol and timeframe.
• Magnitude Scoring (1–10) — every climax receives a strength score derived from its Z-Score, making it easy to distinguish routine spikes from truly extreme events (marked with ★).
🔹 METHODOLOGY
1. Volume Statistics
The script computes a rolling mean and standard deviation of volume over a configurable lookback window (default 50 bars). The Z-Score tells how many standard deviations above the mean the current bar is. A reading of 3.0σ or higher (default threshold) corresponds to the top ~0.27% of bars — statistically rare, not just "above average."
2. Triple Filter Gate
A bar qualifies as a potential climax only when:
• Z-Score ≥ threshold (volume anomaly)
• Bar range ≥ spread multiplier × average range (wide spread)
• Close is in the upper 33% (strength) or lower 33% (weakness) of the bar range
3. Wyckoff Classification
• Buying Climax — qualifying bar during an established uptrend. Interpretation: buyers are exhausting themselves; potential topping action.
• Selling Climax — qualifying bar during an established downtrend. Interpretation: sellers are exhausting themselves; potential basing action.
• When no clear trend exists, classification falls back to close location plus bar direction so that sideways regimes still produce meaningful signals.
4. Confluence Grouping
When multiple same-direction climaxes occur close together in time or price, the script collapses them into a single label representing the strongest event in the cluster. This keeps charts readable without losing information — the panel still counts every individual climax.
5. Effort vs Result (optional)
A companion layer flags high-volume bars with unusually narrow spread — the classic VSA "No Demand" and "No Supply" conditions. These often signal hidden absorption ahead of a reversal and are shown as separate labels.
🔹 SIGNALS & ALERTS
Four built-in alert conditions:
• Buying Climax detected
• Selling Climax detected
• Extreme Climax (Z-Score above the extreme threshold, marked with ★)
• No Demand / No Supply divergence
Each alert payload includes the symbol, Z-Score, and magnitude score, ready for automation or review.
🔹 KEY INPUTS
• Volume Lookback (default 50) — rolling window for statistics.
• Z-Score Threshold (default 3.0σ) — minimum statistical extremity. Lower on intraday, higher for premium signals only.
• Extreme Threshold (default 4.0σ) — above this, climaxes are flagged with a ★.
• Spread and Close filters — each can be toggled independently for flexibility across asset classes.
• Trend EMA Length and Sensitivity — control how the script defines uptrend and downtrend, with an ATR-normalised slope check to avoid misclassifying sideways regimes.
• Reversal Window and Threshold — define what counts as a "successful" reversal for the panel statistic.
• Confluence controls — Time-first (default), Price-first, or Strict mode, plus bar and ATR tolerances.
• Climax Zones (optional, default off) — extends each climax bar's range forward as a reaction zone, similar to S/R.
🔹 HOW TO USE
• Start with defaults on any liquid instrument and timeframe. The script adapts to the local volume distribution automatically.
• On highly volatile intraday timeframes, consider raising the Z-Score Threshold to 3.5σ for fewer, cleaner signals. On slower timeframes, the default works well.
• Treat a ★ Extreme Climax as higher-conviction than a plain climax, and pay attention to the Magnitude Score for fine gradation.
• Use the Reversal Rate panel value as a feedback loop — if it is low on your chosen instrument and timeframe, either adjust thresholds or reconsider the setup.
• Combine with your own structural analysis (support/resistance, HTF trend, market structure) for confirmation. The script identifies the event, not the entry.
🔹 LIMITATIONS & TRANSPARENCY
• This is an indicator, not a strategy. It does not generate buy or sell orders and makes no assumption about position sizing or risk management.
• Climaxes are statistical events. They tend to mark inflection points, but no volume pattern resolves into a reversal every time. The built-in Reversal Rate panel value exists precisely to make this honest — users see the actual hit rate on their own chart.
• The script uses publicly available volume data from the chart's exchange. Volume quality varies by venue; results may differ on symbols with thin or unreliable volume reporting.
• Classification depends on trend context. In strongly sideways regimes, the fallback rules may label climaxes differently than a human analyst would; reviewing the Trend EMA and sensitivity inputs helps here.
• Labels are confirmed on bar close (no repaint). Panel counters and the Current Z-Score value update intrabar for live monitoring.
🔹 RISK DISCLOSURE
Trading involves substantial risk of loss. Past behaviour of any signal or statistic does not guarantee future performance. This script is a research and analysis tool — it is not investment advice, a recommendation, or a solicitation to trade. Users are responsible for their own decisions, risk management, and position sizing. インジケーター

Delta Strike: Order Flow Absorption & Momentum Confirmation**Delta Strike** is a professional-grade quantitative tool designed for traders who prioritize institutional logic over simple price action. It moves beyond traditional "buy/sell" indicators by dissecting the battle between **Passive Absorption** and **Aggressive Initiative** using underlying Order Flow data.
### 🛡️ The Core Philosophy: "Wait for the Trap, Trade the Escape"
Markets rarely reverse instantly. **Delta Strike** follows a rigorous two-step verification process to filter out noise and hunt for high-probability institutional footprints:
1. **Phase 1: Institutional Absorption (Left-Side Setup)**
The system identifies "Base Bars" where high volume and extreme Delta (passive buying/selling) occur, but price fails to continue. This indicates that a large player is absorbing the current move.
2. **Phase 2: Aggressive Strike (Right-Side Confirmation)**
We do not "catch the knife." Instead, the indicator monitors the next **N bars** for a confirmed strike. A signal is only triggered when price engulfs the base bar and is backed by a significant **Active Delta Percentage**, proving that the "absorber" has now become the "aggressor."
### 🚀 Key Technical Features
* **Dual-Cycle Volume Matrix**: Unlike standard indicators, Delta Strike analyzes volume across two lookback periods simultaneously (Short-term 20 & Long-term 50). It classifies setups into three categories:
* 🔥 **Dual-Cycle Convergence** (Maximum Strength)
* ⚡ **Short-term Spike** (Local Volatility)
* 🌊 **Macro Volume Surge** (Long-term Accumulation)
* **Active Delta Intensity Filter**: Every confirmation bar is evaluated for its "Net Win Ratio." By filtering out low-conviction, low-volume breakouts, it ensures you only follow moves with real institutional backing.
* **RSI Environment Guard**: Integrated RSI logic ensures that bottom absorption is only hunted in "Oversold" zones and top absorption in "Overbought" zones, significantly reducing whipsaws in sideways markets.
* **Validated SuperTrend (Delta-Sync)**: A modified SuperTrend algorithm that requires a "Delta Handshake." A trend flip is only considered valid if price and Delta move in the same direction, preventing "fake-outs" during low-liquidity periods.
### 📊 Clean & Actionable UI
* **Base Bar Highlight**: When a setup is confirmed, the script retroactively draws a **Yellow (Bullish)** or **Fuchsia (Bearish)** box around the original absorption bar.
* **Trace Lines**: Dashed lines connect the original institutional entry to your current entry point, providing immediate visual context for the trade's logic.
* **Momentum Rating (🐂/🐻)**:
* **3 Stars (🐂🐂🐂)**: Extreme Delta Strike (>20% Net Win).
* **2 Stars (🐂🐂)**: High Conviction Strike (>10% Net Win).
* **1 Star (🐂)**: Standard Confirmation.
### 🔔 Smart Alert System
Equipped with a fully customizable alert suite. You can set alerts for:
* **Absorption Confirmations** (Long/Short)
* **Validated SuperTrend Breakouts**
*Note: For the most accurate results, it is recommended to use "Any alert() function call" and set frequency to "Once Per Bar Close" to avoid repainting during intra-bar fluctuations.*
---
### How to use:
1. Look for the ** ** label and highlighted box.
2. Wait for the **Strike icons (🐂/🐻)** to appear within the N-bar window.
3. Combine with your existing Support/Resistance levels for optimal strike rates.
--- インジケーター

VSA with Absorption Proxy for Holmes and Bookmap StyleVSA + Absorption Proxy – Holmes / Bookmap Style (No Delta Data Required)
This open-source strategy is a simplified, VSA (Volume Spread Analysis) inspired scalper that approximates **absorption** and **rejection** patterns commonly observed in professional order-flow tools (Bookmap, Holmes, Jigsaw, etc.) — using only standard OHLCV data.
Core Concept & Why This Proxy?
In VSA and order-flow trading, **absorption** occurs when aggressive selling is met with strong buying support (high volume + wide spread + reversal up), often signaling exhaustion of sellers and potential reversal/continuation up. **Rejection** is the mirror: aggressive buying met with strong selling (high volume + wide spread + reversal down).
Because true bid/ask delta is not available in standard Pine Script, this script uses a directional volume proxy:
- delta ≈ volume × (close - open) / (high - low)
- Combined with wide spread (vs ATR) + high volume (vs SMA) + delta flip
This creates a reasonable proxy for spotting climactic volume bars where one side gets absorbed/rejected.
Entry & Exit Logic
Long (Absorption Bull):
- High volume bar (volume > SMA(volume,20) × multiplier)
- Wide spread (range > ATR(14) × multiplier)
- Bullish candle (close > open)
- Delta turns positive after being negative previous bar
Short (Rejection Bear): mirror logic (bearish candle + delta turns negative)
Risk Management (fixed %):
- Stop Loss: entry low/high adjusted by riskPct (default 1%)
- Take Profit: risk × rrTarget (default 3.5:1)
Visuals
- Green background + triangle below bar → Absorption Bull signal
- Red background + triangle above bar → Rejection Bear signal
Important Realism & Backtesting Guidelines
To avoid misleading results, publish/test with:
- Initial Capital: $10,000 – $50,000 (realistic retail/futures account)
- Position sizing: 1–3% equity per trade (adjust via strategy properties)
- Commission: $4–$10 round-turn per contract (futures) or 0.03–0.05% (forex/stocks)
- Slippage: 1–4 ticks (futures) or 0.5–2 pips (forex) — higher during news
- Dataset: ≥12–36 months on chosen timeframe (aim for 400–1000+ trades)
- Risk per trade: 0.5–2% max — never exceed sustainable levels
Expectations:
- Works best on high-volume instruments (NQ, ES, GC, BTC, major forex) during active sessions
- Fewer signals in low-volatility/choppy periods
- Drawdowns common during strong trends — this is a counter-trend / absorption catcher, not trend-following
- News events (FOMC, NFP, earnings) can cause false signals — avoid or widen stops
How to Use
1. Apply to high-liquidity symbols (NQ1!, ES1!, GC1!, BTCUSD, EURUSD, XAUUSD)
2. Timeframes: 3m–15m for scalping, 30m–1h for swing context
3. Trade during high-volume sessions (London/NY overlap for forex, US open for futures)
4. Look for confluence:
- Absorption + nearby support / demand zone → stronger long
- Rejection + nearby resistance / supply zone → stronger short
5. Forward-test on demo extensively — absorption setups are high-conviction but low-frequency
6. Always use proper position sizing — never risk more than 1–2% per trade
Publish Recommendation
- Use a clean chart: only this strategy, no extra indicators/drawings
- Show realistic Strategy Tester results with commission/slippage applied
- Screenshot during active session with visible absorption/rejection signal + background tint
Educational tool — open-source for learning VSA/order-flow concepts. This is a proxy approximation — not true delta/order-flow. Trading involves substantial risk of loss. Test thoroughly and trade responsibly.
Feedback welcome — especially parameter tuning ideas for different instruments! ストラテジー

インジケーター

Effort-Result Divergence [Interakktive]The Effort-Result Divergence (ERD) measures whether volume effort is producing proportional price result. It quantifies the classic Wyckoff principle: when price moves easily, momentum is real; when price struggles despite heavy volume, absorption is occurring.
Think of ERD as "energy efficiency" for price movement — green means price is gliding, red means price is grinding.
█ WHAT IT DOES
• Measures volume EFFORT relative to average volume
• Measures price RESULT relative to ATR-normalized movement
• Computes ERD = Result minus Effort (each scaled 0-100)
• Flags statistical divergences via Z-score analysis
• Absorption events: high effort, low result (negative ERD)
• Vacuum events: low effort, high result (positive ERD)
█ WHAT IT DOES NOT DO
• NO buy/sell signals
• NO entry/exit recommendations
• NO alerts (v1 is educational only)
• NO performance claims or guarantees
This is a context tool for understanding market participation quality.
█ HOW IT WORKS
The ERD analyzes two dimensions of market activity and compares them.
EFFORT (Volume Intensity)
Compares current volume to a moving average baseline:
Effort Ratio = Volume ÷ SMA(Volume, Length)
Effort Score = clamp(100 × Effort Ratio ÷ Effort Cap)
High effort means above-average volume participation.
Low effort means below-average volume participation.
RESULT (Price Efficiency)
Measures how much price moved relative to expected volatility:
Result Ratio = |Close − Previous Close| ÷ ATR
Result Score = clamp(100 × Result Ratio ÷ Result Cap)
High result means price moved significantly for the volatility regime.
Low result means price barely moved despite market activity.
ERD SCORE
ERD = Result − Effort
• Positive ERD: Result exceeds effort → price moved easily (vacuum/thin liquidity)
• Negative ERD: Effort exceeds result → price struggled (absorption/accumulation)
• Near zero: Balanced effort-to-result relationship
STATISTICAL DIVERGENCE DETECTION
Z-score analysis identifies statistically significant extremes:
Z = (ERD − Mean) ÷ StdDev
• Absorption Event: Z ≤ −threshold (extreme negative ERD)
• Vacuum Event: Z ≥ +threshold (extreme positive ERD)
█ INTERPRETATION
GREEN BARS (Positive ERD)
Price moved with relatively little volume effort. This suggests:
• Thin liquidity / low resistance
• Strong directional interest
• Momentum is "real" — not forced
RED BARS (Negative ERD)
Heavy volume was used but price barely moved. This suggests:
• Absorption / accumulation occurring
• Large players opposing the move
• Inefficiency — someone is working hard for little result
THE KEY INSIGHT
When you see:
• Down moves = high effort (red spikes)
• Up moves = low effort (green bars)
This means: It's easier for price to go up than down.
That is asymmetric strength — classic bullish pressure.
The reverse (red on up moves, green on down moves) signals bearish pressure.
PRACTICAL RULES
Without any other indicators:
• Avoid shorting when ERD is mostly green and red spikes appear only on down candles
• Be cautious buying when ERD turns red on up candles (signals absorption of buying pressure)
• Vacuum events (extreme green) often precede continuation or pause — not violent reversal
• Absorption events (extreme red) often precede reversals or range formation
█ VOLUME DATA NOTE
This indicator uses the volume variable which represents:
• Exchange volume on stocks and futures
• Tick volume on Forex and CFD instruments
Tick volume is a proxy for activity, not actual exchange volume. The indicator remains useful on Forex as relative volume comparisons are still meaningful, but interpretation should account for this limitation.
█ INPUTS
Core Settings
• Volume Average Length: Baseline period for effort calculation (default: 20)
• ATR Length: Volatility normalization period (default: 14)
• Effort Cap: Volume ratio that maps to 100% effort (default: 3.0)
• Result Cap: ATR multiple that maps to 100% result (default: 1.0)
Divergence Detection
• Z-Score Lookback: Statistical analysis window (default: 100)
• Z-Score Threshold: Standard deviations for event flags (default: 2.0)
Visual Settings
• Show ERD Histogram: Toggle main display
• Show Zero Line: Toggle reference line
• Show Divergence Markers: Toggle event circles
• Show Effort/Result Lines: Display component breakdown
█ ORIGINALITY
While Wyckoff's effort-versus-result principle is well-established, existing implementations are typically:
• Purely visual with no quantification
• Pattern-based requiring subjective interpretation
• Not statistically normalized for comparison across instruments
ERD is original because it:
1. Normalizes both effort and result to 0-100 scales for direct comparison
2. Uses ATR for result normalization (adapts to volatility regime)
3. Applies statistical Z-score for objective divergence detection
4. Provides quantified output suitable for systematic analysis
█ DATA WINDOW EXPORTS
When enabled, the following values are exported:
• Effort (0-100)
• Result (0-100)
• ERD Score
• Z-Score
• Absorption Event (1/0)
• Vacuum Event (1/0)
█ SUITABLE MARKETS
Works on: Stocks, Futures, Forex, Crypto
Best on: Instruments with reliable volume data (stocks, futures, crypto)
Timeframes: All timeframes — interpretation adapts accordingly
█ RELATED
• Market Efficiency Ratio — measures price path efficiency
• Wyckoff Volume Spread Analysis — conceptual foundation
█ DISCLAIMER
This indicator is for educational purposes only. It does not constitute financial advice. Past performance does not guarantee future results. Always conduct your own analysis before making trading decisions. インジケーター

Price Volume Heatmap [MHA Finverse]Price Volume Heatmap - Advanced Volume Profile Analysis
Unlock the power of institutional-level volume analysis with the Price Volume Heatmap indicator. This sophisticated tool visualizes market structure through volume distribution across price levels, helping you identify key support/resistance zones, high-probability reversal areas, and optimal entry/exit points.
🎯 What Makes This Indicator Unique?
Unlike traditional volume indicators that only show volume over time, this heatmap displays volume distribution across price levels , revealing where the most significant trading activity occurred. The gradient coloring system instantly highlights high-volume nodes (areas of strong interest) and low-volume nodes (potential breakout zones).
📊 Core Features
1. Dynamic Volume Heatmap
- Visualizes volume concentration across 250 customizable price levels
- Gradient color scheme from high volume (white) to low volume (teal/green)
- Adjustable brightness multiplier for enhanced contrast and clarity
- Real-time updates as market conditions evolve
2. Point of Control (POC)
- Automatically identifies the price level with the highest traded volume
- Acts as a magnetic price level where markets often return
- Critical for identifying fair value areas and potential reversal zones
- Customizable line style, width, and color
3. Flexible Lookback Settings
- Lookback Bars: Set any value from 1-5000 bars to control analysis depth
- Visible Range Mode: Analyze only what's currently visible on your chart
- Timeframe-Specific Settings: Different lookback periods for 1m, 5m, 15m, 30m, 1h, Daily, and Weekly charts
- Adapts to your trading style - scalping to position trading
4. Session Separation Analysis
- Tokyo Session: 00:00-09:00 UTC
- London Session: 07:00-16:00 UTC
- New York Session: 13:00-22:00 UTC
- Sydney Session: 21:00-06:00 UTC
- Daily Reset: Analyze each trading day independently
Session separation allows you to understand volume distribution specific to each major trading session, revealing institutional order flow patterns and session-specific support/resistance levels.
5. Profile Width Options
- Dynamic: Profile width adjusts based on lookback period
- Fixed Bars: Set a specific bar count for consistent profile width
- Extend Forward: Project the profile into future bars for planning trades
6. Smart Alerts
- POC crossover/crossunder alerts
- New session start notifications
- Never miss critical price action at high-volume nodes
📈 How to Use This Indicator Professionally
Understanding Market Structure:
High Volume Nodes (HVN):
- Appear as bright/white areas in the heatmap
- Represent price levels where significant trading occurred
- Act as strong support/resistance zones
- Markets often consolidate or bounce from these levels
- Trading Strategy: Look for entries when price tests HVN areas with confluence from other indicators
Low Volume Nodes (LVN):
- Appear as darker/teal areas in the heatmap
- Represent price levels with minimal trading activity
- Price tends to move quickly through these areas
- Often form "gaps" in the volume profile
- Trading Strategy: Expect rapid price movement through LVN zones; avoid placing stop losses here
Point of Control (POC):
- The single most important price level in your analysis window
- Represents the fairest price where maximum volume traded
- Price gravitates toward POC like a magnet
- Trading Strategy:
* When price is above POC: bullish bias, POC acts as support
* When price is below POC: bearish bias, POC acts as resistance
* POC breaks often lead to significant trend changes
Session-Based Analysis:
Use session separation to understand how different market participants trade:
Asian Session (Tokyo/Sydney):
- Typically lower volatility and range-bound
- Volume profiles often show tight, balanced distribution
- Use for identifying overnight ranges and gap fill zones
London Session:
- Highest volume session for forex pairs
- Often shows strong directional bias
- Look for breakouts from Asian ranges during London open
New York Session:
- Maximum participation when overlapping with London
- Institutional order flow most visible
- POC during NY session often becomes key level for following sessions
🎯 Practical Trading Applications
1. Identifying Support & Resistance:
High volume nodes from the heatmap are far more reliable than traditional swing highs/lows. When price approaches an HVN, expect reaction - either a bounce or a significant breakout if breached.
2. Trend Confirmation:
- Healthy uptrend: POC rising over time, HVN forming at higher levels
- Healthy downtrend: POC falling over time, HVN forming at lower levels
- Consolidation: POC relatively flat, volume balanced across range
3. Breakout Trading:
When price breaks through a Low Volume Node with momentum, it often continues to the next High Volume Node. Use LVN areas as measured move targets.
4. Reversal Zones:
Multiple HVN stacking on top of each other creates a "volume shelf" - an extremely strong support/resistance zone where reversals are highly probable.
5. Risk Management:
- Place stops beyond HVN areas (not within LVN zones)
- Size positions based on distance to nearest HVN
- Use POC as trailing stop level in trending markets
⚙️ Recommended Settings
For Day Trading (Scalping/Intraday):
- Lookback: 200-500 bars
- Rows: 200-250
- Enable session separation for your primary trading session
- Profile Width: Dynamic or Fixed Bars (30-50)
For Swing Trading:
- Lookback: 500-1000 bars
- Rows: 250
- Session separation: Daily Reset
- Profile Width: Dynamic
For Position Trading:
- Lookback: 1000-3000 bars
- Rows: 250
- Use timeframe-specific settings
- Profile Width: Extend Forward (20-50 bars)
💡 Pro Tips
1. Combine this indicator with price action analysis - volume confirms what price is telling you
2. Watch for POC convergence with other technical levels (fibonacci, pivot points, moving averages)
3. Volume at extremes (tops/bottoms of heatmap) often indicates exhaustion
4. Session POC from previous sessions often acts as magnet for current session
5. Increase brightness multiplier (1.5-2.5) for clearer visualization on busy charts
6. Use "Number of Sessions to Display" to analyze consistency of volume levels across multiple sessions
🎨 Customization
Fully customizable visual appearance:
- Gradient colors for volume visualization
- POC line thickness, color, and style
- Session line colors and visibility
- All settings organized in intuitive groups
⚠️ Disclaimer
This indicator is a technical analysis tool and should not be used as the sole basis for trading decisions. Always combine volume analysis with proper risk management, fundamental analysis, and other technical indicators. Past performance does not guarantee future results.
---
Support & Updates
Regular updates and improvements are made to enhance functionality. For questions, suggestions, or bug reports, please use the comments section below.
Happy Trading! 📊💹 インジケーター

Dynamic Support and Resistance with Trend LinesDynamic Support and Resistance with Trend Lines (DSRTL)
1. Introduction & Methodology
The DSRTL indicator is designed to provide a multidimensional analysis of market structure. Unlike traditional tools that rely solely on price pivots, this script combines Static Volume-based Zones with Dynamic Trend Lines to evaluate the price's position relative to critical market components.
The S/R Identification Technique
Instead of standard pivot points, DSRTL utilizes Volume Analysis to highlight areas of significant trader participation:
- Strategy A:
Matrix Climax: Identifies candles within the lookback period that are near price extremes (Highs/Lows) and coincide with significant buying or selling volume.
- Strategy B:
Volume Extremes: Detects candles with the absolute highest buy/sell volumes within the selected lookback window, creating extreme volume-based S/R zones.
- Result:
This creates Support/Resistance (S/R) zones that are validated by actual market activity, not just price geometry.
Dynamic Trend Lines
To complement the static zones, the indicator employs two adaptive channel methods:
- Pivot Span: Connects recent significant pivots for a fast, reactive trend corridor.
- 5-Point Channel: Segments the lookback period into 5 parts to perform a linear regression analysis, creating a stable and statistically significant channel.
2. Volume Calculation Methodology
Accurate S/R detection requires distinguishing Buy Volume from Sell Volume. DSRTL offers two calculation modes:
- Geometry (Source File): Estimates buy/sell volume based on the Close price's position relative to the High/Low of the candle.
Note: This is an approximation that works on all plan types as it does not require intrabar data.
- Intrabar (Precise): Analyzes historical lower-timeframe data (e.g., 15S) to calculate intrabar-based volume deltas with higher precision compared to the geometric method.
Note: This offers superior accuracy. It requires access to historical intrabar data (depending on your plan limits). For the best analytical results, use this mode if available.
3. The Smart Matrix Engine (3D Analysis)
The core of DSRTL is its dashboard, powered by the "Smart Matrix Engine." This engine evaluates the current price in a multi-layer market structure context (Static Volume Zones + Dynamic Channels + Volume Metrics).:
A. S-State (Static): Where is the price relative to the Volume S/R zones?
B. D-State (Dynamic): Where is the price relative to the Trend Channels?
How to read the Matrix Map:
The dashboard displays a 5x5 grid representing 25 possible market scenarios.
- Rows (S1-S5): Represent the Static State (S1=Breakout, S3=Mid-Range, S5=Breakdown).
- Columns (D1-D5): Represent the Dynamic State (D1=Overextended Up, D3=Neutral, D5=Overextended Down).
- Active Cell: Marked with a dot, indicating the specific intersection of price action and market structure.
4. Matrix Interpretations (The 25 Scenarios)
Below is the detailed logic for every possible state displayed on the dashboard, explaining the Title, Bias, and actionable Signal.
Section I: S1 - Static Breakout (Price > Static Resistance)
The price has cleared the static volume resistance zone.
- S1 / D1: HYPER EXTENSION
Bias: Extreme Bullish
Signal: Caution: Exhaustion Risk. Trail stops tight.
- S1 / D2: RESISTANCE CLASH
Bias: Bullish
Signal: Breakout confirmed but facing immediate dynamic resistance.
- S1 / D3: CHANNEL BREAKOUT
Bias: Strong Bullish
Signal: Ideal Trend Continuation. Look to buy dips.
- S1 / D4: SMART PULLBACK
Bias: Bullish (Pullback)
Signal: A pullback occurring after a breakout. Strong buy opportunity.
- S1 / D5: CONFLICT (DIV)
Bias: Conflict/Reversal
Signal: Major Divergence. Static breakout is failing against dynamic structure. High Risk.
Section II: S2 - Inside Static Resistance
The price is currently testing the overhead resistance zone.
- S2 / D1: WEAK SPIKE
Bias: Neutral/Bullish
Signal: Testing resistance, but short-term overextended.
- S2 / D2: IRON FORTRESS (R)
Bias: Rejection Risk
Signal: Double Resistance (Static + Dynamic). High probability of rejection.
- S2 / D3: TESTING RES
Bias: Neutral
Signal: Consolidating at resistance. Wait for a clear break or rejection.
- S2 / D4: COMPRESSION (UP)
Bias: Conflict (Squeeze)
Signal: Squeezed between Static Resistance and Dynamic Support. Volatility imminent.
- S2 / D5: RES vs DOWN-TREND
Bias: Bearish
Signal: Strong downtrend meeting static resistance. Potential Short entry.
Section III: S3 - Mid-Range
The price is floating between significant Static Support and Resistance.
- S3 / D1: OVERBOUGHT RANGE
Bias: Rejection Risk (OB)
Signal: Overextended within the range. Potential fade (short).
- S3 / D2: RANGE HIGH LIMIT
Bias: Neutral/Bearish
Signal: At the top of the dynamic channel. Look for rejection signs.
- S3 / D3: NEUTRAL / CHOPPY
Bias: Neutral
Signal: Dead Center. Low probability environment. Avoid trading.
- S3 / D4: RANGE DIP BUY
Bias: Neutral/Bullish
Signal: At the bottom of the dynamic channel. Look for bounce signs.
- S3 / D5: WEAK RANGE (OS)
Bias: Bounce Risk (OS)
Signal: Oversold within the range. Potential fade (long).
Section IV: S4 - Inside Static Support
The price is currently testing the floor support zone.
- S4 / D1: SUP vs UP-TREND
Bias: Bullish
Signal: Strong uptrend meeting static support. Potential Long entry.
- S4 / D2: COMPRESSION (DN)
Bias: Conflict (Squeeze)
Signal: Squeezed between Static Support and Dynamic Resistance. Volatility imminent.
- S4 / D3: TESTING SUPPORT
Bias: Neutral
Signal: Consolidating at support. Wait for a bounce or breakdown.
- S4 / D4: IRON FLOOR (S)
Bias: Bounce Risk
Signal: Double Support (Static + Dynamic). High probability of a bounce.
- S4 / D5: WEAK DIP
Bias: Neutral/Bearish
Signal: Testing support, but short-term oversold.
Section V: S5 - Static Breakdown (Price < Static Support)
The price has dropped below the static volume support zone.
- S5 / D1: CONFLICT (DIV)
Bias: Conflict/Reversal
Signal: Major Divergence. Static breakdown is failing. High Risk.
- S5 / D2: BEAR PULLBACK
Bias: Bearish (Pullback)
Signal: A pullback occurring after a breakdown. Strong selling opportunity.
- S5 / D3: CHANNEL BREAKDOWN
Bias: Strong Bearish
Signal: Ideal Trend Continuation (Down). Sell rallies.
- S5 / D4: SUPPORT CLASH
Bias: Bearish
Signal: Breakdown confirmed but facing immediate dynamic support.
- S5 / D5: HYPER DROP (VOID)
Bias: Extreme Bearish
Signal: Caution: Climax risk. Trail stops for shorts.
DISCLAIMER & EDUCATIONAL PURPOSE
This indicator is strictly an educational tool designed to visualize complex market structure concepts. Its primary purpose is to help traders "bridge the gap" between academic theory and real-time market behavior by providing a visual representation of support, resistance, and volume dynamics.
Please Note:
1. Not a Trading Strategy: This script is an analytical assistant, not a standalone "Black Box" trading system. It does not generate buy or sell signals that should be followed blindly.
2. No Financial Advice: The data provided by this tool is for informational purposes only. It is not a recommendation to buy or sell any asset.
3. Risk Warning: Trading involves significant risk. Always use your own judgment, perform your own technical analysis, and use proper risk management. Do not use this tool as the sole basis for your trading decisions.
4. Data Precision & Platform Limits: The "Intrabar (Precise)" calculation mode relies on high-resolution historical data to provide exact results. Access to this specific data depth depends entirely on your platform's subscription capabilities. If your plan does not support this level of historical intrabar data, the Precise mode may have limited coverage. In that case, you should switch to "Geometry" mode for a fully populated view. インジケーター

インジケーター

インジケーター

インジケーター

インジケーター

インジケーター

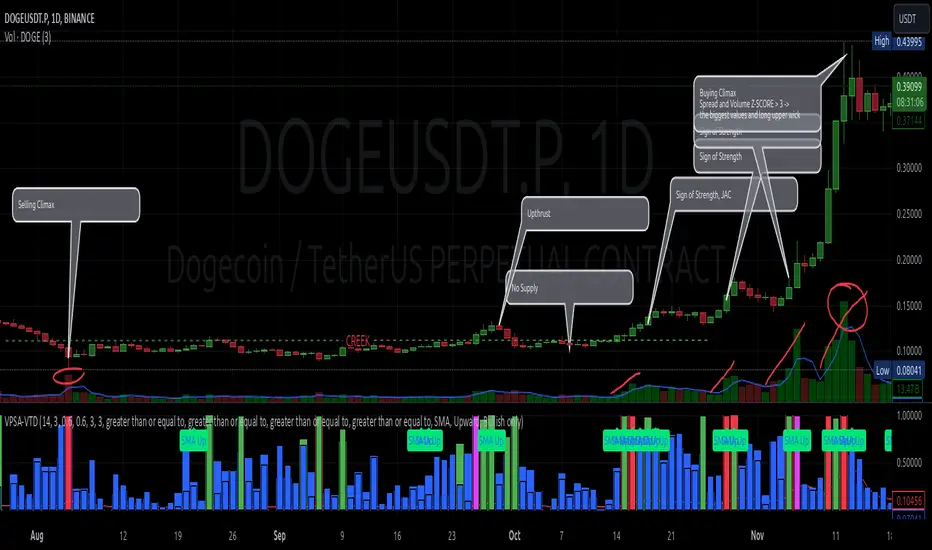
VPSA-VTDDear Sir/Madam,
I am pleased to present the next iteration of my indicator concept, which, in my opinion, serves as a highly useful tool for analyzing markets using the Volume Spread Analysis (VSA) method or the Wyckoff methodology.
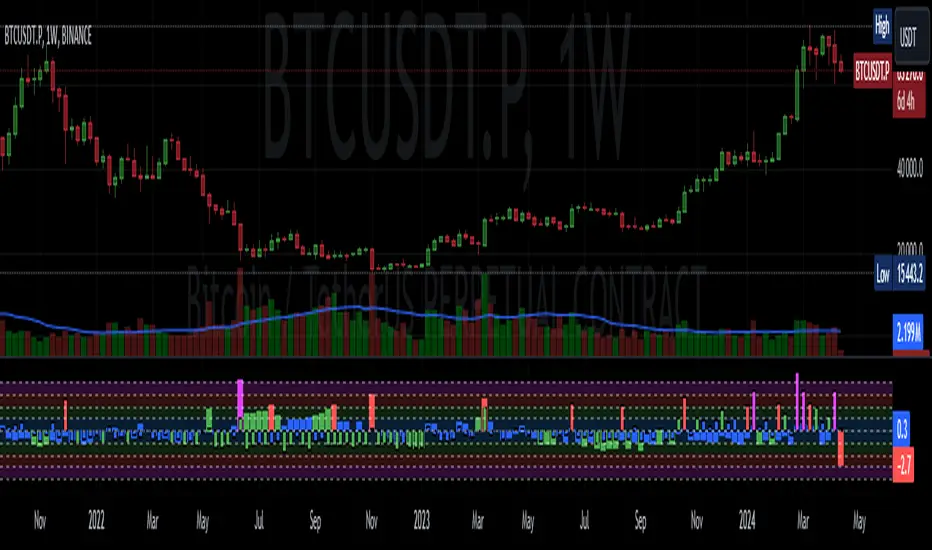
The VPSA (Volume-Price Spread Analysis), the latest version in the family of scripts I’ve developed, appears to perform its task effectively. The combination of visualizing normalized data alongside their significance, achieved through the application of Z-Score standardization, proved to be a sound solution. Therefore, I decided to take it a step further and expand my project with a complementary approach to the existing one.
Theory
At the outset, I want to acknowledge that I’m aware of the existence of other probabilistic models used in financial markets, which may describe these phenomena more accurately. However, in line with Occam's Razor, I aimed to maintain simplicity in the analysis and interpretation of the concepts below. For this reason, I focused on describing the data using the Gaussian distribution.
The data I read from the chart — primarily the closing price, the high-low price difference (spread), and volume — exhibit cyclical patterns. These cycles are described by Wyckoff's methodology, while VSA complements and presents them from a different perspective. I will refrain from explaining these methods in depth due to their complexity and broad scope. What matters is that within these cycles, various events occur, described by candles or bars in distinct ways, characterized by different spreads and volumes. When observing the chart, I notice periods of lower volatility, often accompanied by lower volumes, as well as periods of high volatility and significant volumes. It’s important to find harmony within this apparent chaos. I think that chart interpretation cannot happen without considering the broader context, but the more variables I include in the analytical process, the more challenges arise. For instance, how can I determine if something is large (wide) or small (narrow)? For elements like volume or spread, my script provides a partial answer to this question. Now, let’s get to the point.
Technical Overview
The first technique I applied is Min-Max Normalization. With its help, the script adjusts volume and spread values to a range between 0 and 1. This allows for a comparable bar chart, where a wide bar represents volume, and a narrow one represents spread. Without normalization, visually comparing values that differ by several orders of magnitude would be inconvenient. If the indicator shows that one bar has a unit spread value while another has half that value, it means the first bar is twice as large. The ratio is preserved.
The second technique I used is Z-Score Standardization. This concept is based on the normal distribution, characterized by variables such as the mean and standard deviation, which measures data dispersion around the mean. The Z-Score indicates how many standard deviations a given value deviates from the population mean. The higher the Z-Score, the more the examined object deviates from the mean. If an object has a Z-Score of 3, it falls within 0.1% of the population, making it a rare occurrence or even an anomaly. In the context of chart analysis, such strong deviations are events like climaxes, which often signal the end of a trend, though not always. In my script, I assigned specific colors to frequently occurring Z-Score values:
Below 1 – Blue
Above 1 – Green
Above 2 – Red
Above 3 – Fuchsia
These colors are applied to both spread and volume, allowing for quick visual interpretation of data.
Volume Trend Detector (VTD)
The above forms the foundation of VPSA. However, I have extended the script with a Volume Trend Detector (VTD). The idea is that when I consider market structure - by market structure, I mean the overall chart, support and resistance levels, candles, and patterns typical of spread and volume analysis as well as Wyckoff patterns - I look for price ranges where there is a lack of supply, demand, or clues left behind by Smart Money or the market's enigmatic identity known as the Composite Man. This is essential because, as these clues and behaviors of market participants — expressed through the chart’s dynamics - reflect the actions, decisions, and emotions of all players. These behaviors can help interpret the bull-bear battle and estimate the probability of their next moves, which is one of the key factors for a trader relying on technical analysis to make a trade decision.
I enhanced the script with a Volume Trend Detector, which operates in two modes:
Step-by-Step Logic
The detector identifies expected volume dynamics. For instance, when looking for signs of a lack of bullish interest, I focus on setups with decreasing volatility and volume, particularly for bullish candles. These setups are referred to as No Demand patterns, according to Tom Williams' methodology.
Simple Moving Average (SMA)
The detector can also operate based on a simple moving average, helping to identify systematic trends in declining volume, indicating potential imbalances in market forces.
I’ve designed the program to allow the selection of candle types and volume characteristics to which the script will pay particular attention and notify me of specific market conditions.
Advantages and Disadvantages
Advantages:
Unified visualization of normalized spread and volume, saving time and improving efficiency.
The use of Z-Score as a consistent and repeatable relative mechanism for marking examined values.
The use of colors in visualization as a reference to Z-Score values.
The possibility to set up a continuous alert system that monitors the market in real time.
The use of EMA (Exponential Moving Average) as a moving average for Z-Score.
The goal of these features is to save my time, which is the only truly invaluable resource.
Disadvantages:
The assumption that the data follows a normal distribution, which may lead to inaccurate interpretations.
A fixed analysis period, which may not be perfectly suited to changing market conditions.
The use of EMA as a moving average for Z-Score, listed both as an advantage and a disadvantage depending on market context.
I have included comments within the code to explain the logic behind each part. For those who seek detailed mathematical formulas, I invite you to explore the code itself.
Defining Program Parameters:
Numerical Conditions:
VPSA Period for Analysis – The number of candles analyzed.
Normalized Spread Alert Threshold – The expected normalized spread value; defines how large or small the spread should be, with a range of 0-1.00.
Normalized Volume Alert Threshold – The expected normalized volume value; defines how large or small the volume should be, with a range of 0-1.00.
Spread Z-SCORE Alert Threshold – The Z-SCORE value for the spread; determines how much the spread deviates from the average, with a range of 0-4 (a higher value can be entered, but from a logical standpoint, exceeding 4 is unnecessary).
Volume Z-SCORE Alert Threshold – The Z-SCORE value for volume; determines how much the volume deviates from the average, with a range of 0-4 (the same logical note as above applies).
Logical Conditions:
Logical conditions describe whether the expected value should be less than or equal to or greater than or equal to the numerical condition.
All four parameters accept two possibilities and are analogous to the numerical conditions.
Volume Trend Detector:
Volume Trend Detector Period for Analysis – The analysis period, indicating the number of candles examined.
Method of Trend Determination – The method used to determine the trend. Possible values: Step by Step or SMA.
Trend Direction – The expected trend direction. Possible values: Upward or Downward.
Candle Type – The type of candle taken into account. Possible values: Bullish, Bearish, or Any.
The last available setting is the option to enable a joint alert for VPSA and VTD.
When enabled, VPSA will trigger on the last closed candle, regardless of the VTD analysis period.
Example Use Cases (Labels Visible in the Script Window Indicate Triggered Alerts):
The provided labels in the chart window mark where specific conditions were met and alerts were triggered.
Summary and Reflections
The program I present is a strong tool in the ongoing "game" with the Composite Man.
However, it requires familiarity and understanding of the underlying methodologies to fully utilize its potential.
Of course, like any technical analysis tool, it is not without flaws. There is no indicator that serves as a perfect Grail, accurately signaling Buy or Sell in every case.
I would like to thank those who have read through my thoughts to the end and are willing to take a closer look at my work by using this script.
If you encounter any errors or have suggestions for improvement, please feel free to contact me.
I wish you good health and accurately interpreted market structures, leading to successful trades!
CatTheTrader インジケーター

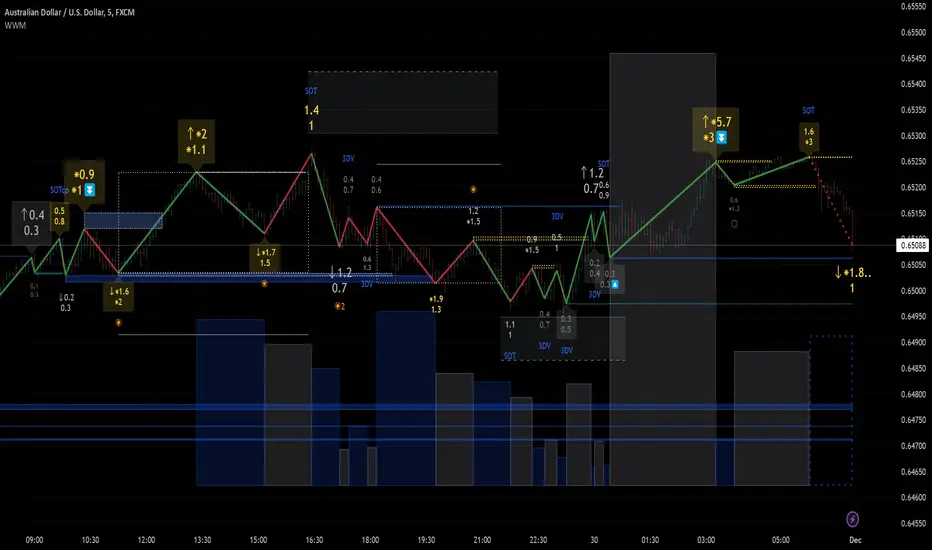
Weis Wave Max█ Overview
Weis Wave Max is the result of my weis wave study.
David Weis said,
"Trading with the Weis Wave involves changes in behavior associated with springs, upthrusts, tests of breakouts/breakdowns, and effort vs reward. The most common setup is the low-volume pullback after a bullish/bearish change in behavior."
THE STOCK MARKET UPDATE (February 24, 2013)
I inspired from his sentences and made this script.
Its Main feature is to identify the largest wave in Weis wave and advantageous trading opportunities.
█ Features
This indicator includes several features related to the Weis Wave Method.
They help you analyze which is more bullish or bearish.
Highlight Max Wave Value (single direction)
Highlight Abnormal Max Wave Value (both directions)
Support and Resistance zone
Signals and Setups
█ Usage
Weis wave indicator displays cumulative volume for each wave.
Wave volume is effective when analyzing volume from VSA (Volume Spread Analysis) perspective.
The basic idea of Weis wave is large wave volume hint trend direction. This helps identify proper entry point.
This indicator highlights max wave volume and displays the signal and then proper Risk Reward Ratio entry frame.
I defined Change in Behavior as max wave volume (single direction).
Pullback is next wave that does not exceed the starting point of CiB wave (LH sell entry, HL buy entry).
Change in Behavior Signal ○ appears when pullback is determined.
Change in Behavior Setup (Entry frame) appears when condition of Min/Max Pullback is met and follow through wave breaks end point of CiB wave.
This indicator has many other features and they can also help a user identify potential levels of trade entry and which is more bullish or bearish.
In the screenshot below we can see wave volume zones as support and resistance levels. SOT and large wave volume /delta price (yellow colored wave text frame) hint stopping action.
█ Settings
Explains the main settings.
-- General --
Wave size : Allows the User to select wave size from ① Fixed or ② ATR. ② ATR is Factor x ATR(Length).
Display : Allows the User to select how many wave text and zigzag appear.
-- Wave Type --
Wave type : Allows the User to select from Volume or Volume and Time.
Wave Volume / delta price : Displays Wave Volume / delta price.
Simplified value : Allows the User to select wave text display style from ① Divisor or ② Normalized. Normalized use SMA.
Decimal : Allows the User to select the decimal point in the Wave text.
-- Highlight Abnormal Wave --
Highlight Max Wave value (single direction) : Adds marks to the Wave text to highlight the max wave value.
Lookback : Allows the User to select how many waves search for the max wave value.
Highlight Abnormal Wave value (both directions) : Changes wave text size, color or frame color to highlight the abnormal wave value.
Lookback : Allows the User to select SMA length to decide average wave value.
Large/Small factor : Allows the User to select the threshold large wave value and small wave value. Average wave value is 1.
delta price : Highlights large delta price by large wave text size, small by small text size.
Wave Volume : Highlights large wave volume by yellow colored wave text, small by gray colored.
Wave Volume / delta price : highlights large Wave Volume / delta price by yellow colored wave text frame, small by gray colored.
-- Support and Resistance --
Single side Max Wave Volume / delta price : Draws dashed border box from end point of Max wave volume / delta price level.
Single side Max Wave Volume : Draws solid border box from start point of Max wave volume level.
Bias Wave Volume : Draws solid border box from start point of bias wave volume level.
-- Signals --
Bias (Wave Volume / delta price) : Displays Bias mark when large difference in wave volume / delta price before and after.
Ratio : Decides the threshold of become large difference.
3Decrease : Displays 3D mark when a continuous decrease in wave volume.
Shortening Of the Thrust : Displays SOT mark when a continuous decrease in delta price.
Change in Behavior and Pullback : Displays CiB mark when single side max wave volume and pullback.
-- Setups --
Change in Behavior and Pullback and Breakout : Displays entry frame when change in behavior and pullback and then breakout.
Min / Max Pullback : Decides the threshold of min / max pullback.
If you need more information, please read the indicator's tooltip.
█ Conclusion
Weis Wave is powerful interpretation of volume and its tell us potential trend change and entry point which can't find without weis wave.
It's not the holy grail, but improve your chart reading skills and help you trade rationally (at least from VSA perspective). インジケーター

インジケーター

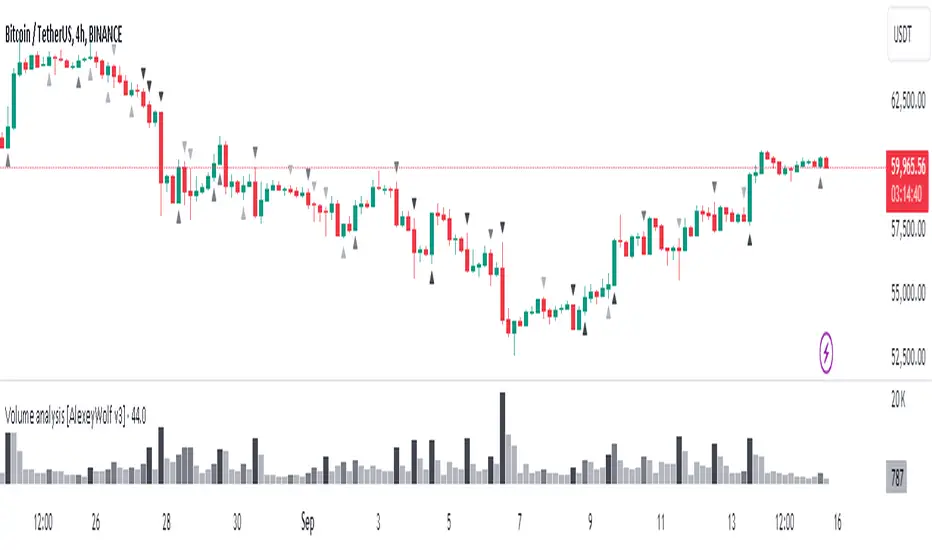
Decoding the Volume of candlesThe indicator is designed for traders who are more interested in market structures and price action using volumes. Volume analysis can help traders build a clearer understanding of zones of buyer and seller interest, as well as liquidity gathering points (traders' stop levels).
Key Features:
The indicator visualizes on the chart the volumes selected according to the trader's chosen settings.
The indicator highlights candle volumes in selected colors, where the volume is greater individually than the volumes of the trader's chosen number of preceding candles. Or the volume that is greater than the sum of volumes of the trader's chosen number of preceding candles.
The indicator mark selected volumes on the chart based on the type of candle. The candle type (1, 2, or 3) is determined by its result (close) relative to other candles.
Volume marked for a type 3 candle draws the trader’s attention to the lack of results from the applied volume compared to the previous candle, indicating potential weakness of the candle’s owner. This is especially important in buyer or seller context areas.
Volume marked for a type 2 candle highlights the presence of results from the applied volume but only relative to the previous candle. In buyer or seller context areas, this can signal weakness of the candle’s owner.
Volume marked for a type 1 candle signals a strong result from the applied volume, indicating potential strength of the candle’s owner.
The marking of volumes can be displayed either on the main chart or on the volume chart, depending on the trader's preference. Colors and symbols for marking can be customized on the Style tab.
Volumes can be filtered on both the volume chart and the main chart according to their marking. This feature can be useful, for example, for traders who don’t work with signs of buyer or seller weakness. In such cases, they can filter out volumes only for type 1 candles.
Good luck exploring the impact of volumes on price behavior!
インジケーター

VPSA - Volume Price Spread AnalysisDear Analysts and Traders,
I am pleased to present the latest version of my indicator, based on the logic of analyzing spread and volume. In this version, the indicator examines spread and volume using min-max normalization. The statistical value is captured through Z-Score standardization, and I have added configurable alerts based on the normalized values of spread, volume, and the sigmas for these variables.
Theory and Evolution of the Indicator
The normalization function used in this program allows for the comparison of two values with different ranges on a single chart. The values that reach the highest within the examined range are assigned a value of one. As in previous versions, I have adopted a bar chart where the wider bar represents volume and the narrower bar represents spread. I believe that using normalization is the most intuitive approach, as the standardization in the earlier sVPSA version could cause confusion. This was due to smaller bars for higher actual values and negative bars, which required additional reliance on actual volume data and significant proficiency in using the indicator. These were limitations stemming from the computational aspect of these issues. As in the previously mentioned script, I also used Z-Score standardization here, which serves as a measure of deviation from the mean. This is visualized in the script as the color of the bars, which in the default configuration are as follows: below one sigma - blue; above one sigma up to two sigmas - green; above two sigmas up to three sigmas - red; and above three sigmas - fuchsia. Additionally, I applied an exponential moving average in this indicator to minimize the influence of older candles on the mean. The indicator has been enhanced with configurable alerts, allowing for substantial control over the conditions triggering them. The alerts enable the definition of normalized variable values and sigma values. Furthermore, the program allows for the definition of logical dependencies for these conditions.
Summary
The program I have developed is a synthesis of the most important and useful functions from the indicators I previously created. The indicator is a standalone and powerful tool that facilitates effective analysis of the spread-volume relationship, which is one of the fundamental methods of analysis according to the Wyckoff and VSA methodologies. The alerts introduced in this version provide extensive possibilities for controlling the dynamics of any market.
Should you encounter any errors or have suggestions regarding the indicator, please feel free to contact me.
I wish you successful analyses! All the best!
CatTheTrader インジケーター

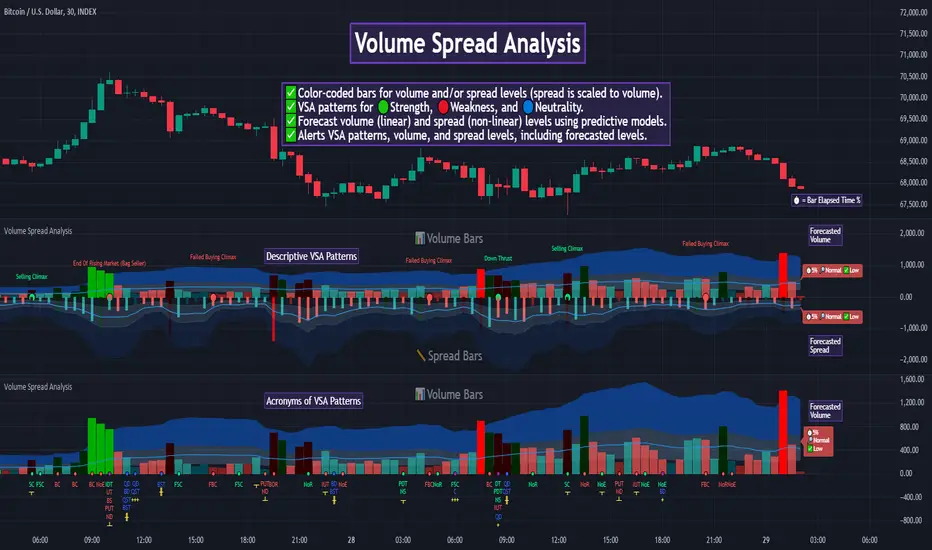
Auto Volume Spread Analysis (VSA) [TANHEF]Auto Volume Spread Analysis (visible volume and spread bars auto-scaled): Understanding Market Intentions through the Interpretation of Volume and Price Movements.
All the sections below contain the same descriptions as my other indicator "Volume Spread Analysis" with the exception of 'Auto Scaling'.
█ Auto-Scaling
This indicator auto-scales spread bars to match the visible volume bars, unlike the previous "Volume Spread Analysis " version which limited the number of visible spread bars to a fixed count. The auto-scaling feature allows for easier navigation through historical data, enabling both more historical spread bars to be viewed and more historical VSA pattern labels being displayed without requiring using the bar replay tool. Please note that this indicator’s auto-scaling feature recalculates the visible bars on the chart, causing the indicator to reload whenever the chart is moved.
Auto-scaled spread bars have two display options (set via 'Spread Bars Method' setting):
Lines: a bar lookback limit of 500 bars.
Polylines: no bar lookback limit as only plotted on visible bars on chart, which uses multiple polylines are used.
█ Simple Explanation:
The Volume Spread Analysis (VSA) indicator is a comprehensive tool that helps traders identify key market patterns and trends based on volume and spread data. This indicator highlights significant VSA patterns and provides insights into market behavior through color-coded volume/spread bars and identification of bars indicating strength, weakness, and neutrality between buyers and sellers. It also includes powerful volume and spread forecasting capabilities.
█ Laws of Volume Spread Analysis (VSA):
The origin of VSA begins with Richard Wyckoff, a pivotal figure in its development. Wyckoff made significant contributions to trading theory, including the formulation of three basic laws:
The Law of Supply and Demand: This fundamental law states that supply and demand balance each other over time. High demand and low supply lead to rising prices until demand falls to a level where supply can meet it. Conversely, low demand and high supply cause prices to fall until demand increases enough to absorb the excess supply.
The Law of Cause and Effect: This law assumes that a 'cause' will result in an 'effect' proportional to the 'cause'. A strong 'cause' will lead to a strong trend (effect), while a weak 'cause' will lead to a weak trend.
The Law of Effort vs. Result: This law asserts that the result should reflect the effort exerted. In trading terms, a large volume should result in a significant price move (spread). If the spread is small, the volume should also be small. Any deviation from this pattern is considered an anomaly.
█ Volume and Spread Analysis Bars:
Display: Volume and spread bars that consist of color coded levels, with the spread bars scaled to match the volume bars. A displayable table (Legend) of bar colors and levels can give context and clarify to each volume/spread bar.
Calculation: Levels are calculated using multipliers applied to moving averages to represent key levels based on historical data: low, normal, high, ultra. This method smooths out short-term fluctuations and focuses on longer-term trends.
Low Level: Indicates reduced volatility and market interest.
Normal Level: Reflects typical market activity and volatility.
High Level: Indicates increased activity and volatility.
Ultra Level: Identifies extreme levels of activity and volatility.
This illustrates the appearance of Volume and Spread bars when scaled and plotted together:
█ Forecasting Capabilities:
Display: Forecasted volume and spread levels using predictive models.
Calculation: Volume and Spread prediction calculations differ as volume is linear and spread is non-linear.
Volume Forecast (Linear Forecasting): Predicts future volume based on current volume rate and bar time till close.
Spread Forecast (Non-Linear Dynamic Forecasting): Predicts future spread using a dynamic multiplier, less near midpoint (consolidation) and more near low or high (trending), reflecting non-linear expansion.
Moving Averages: In forecasting, moving averages utilize forecasted levels instead of actual levels to ensure the correct level is forecasted (low, normal, high, or ultra).
The following compares forecasted volume with actual resulting volume, highlighting the power of early identifying increased volume through forecasted levels:
█ VSA Patterns:
Criteria and descriptions for each VSA pattern are available as tooltips beside them within the indicator’s settings. These tooltips provide explanations of potential developments based on the volume and spread data.
Signs of Strength (🟢): Patterns indicating strong buying pressure and potential market upturns.
Down Thrust
Selling Climax
No Effort ➤ Bearish Result
Bearish Effort ➤ No Result
Inverse Down Thrust
Failed Selling Climax
Bull Outside Reversal
End of Falling Market (Bag Holder)
Pseudo Down Thrust
No Supply
Signs of Weakness (🔴): Patterns indicating strong selling pressure and potential market downturns.
Up Thrust
Buying Climax
No Effort ➤ Bullish Result
Bullish Effort ➤ No Result
Inverse Up Thrust
Failed Buying Climax
Bear Outside Reversal
End of Rising Market (Bag Seller)
Pseudo Up Thrust
No Demand
Neutral Patterns (🔵): Patterns indicating market indecision and potential for continuation or reversal.
Quiet Doji
Balanced Doji
Strong Doji
Quiet Spinning Top
Balanced Spinning Top
Strong Spinning Top
Quiet High Wave
Balanced High Wave
Strong High Wave
Consolidation
Bar Patterns (🟡): Common candlestick patterns that offer insights into market sentiment. These are required in some VSA patterns and can also be displayed independently.
Bull Pin Bar
Bear Pin Bar
Doji
Spinning Top
High Wave
Consolidation
This demonstrates the acronym and descriptive options for displaying bar patterns, with the ability to hover over text to reveal the descriptive text along with what type of pattern:
█ Alerts:
VSA Pattern Alerts: Notifications for identified VSA patterns at bar close.
Volume and Spread Alerts: Alerts for confirmed and forecasted volume/spread levels (Low, High, Ultra).
Forecasted Volume and Spread Alerts: Alerts for forecasted volume/spread levels (High, Ultra) include a minimum percent time elapsed input to reduce false early signals by ensuring sufficient bar time has passed.
█ Inputs and Settings:
Indicator Bar Color: Select color schemes for bars (Normal, Detail, Levels).
Indicator Moving Average Color: Select schemes for bars (Fill, Lines, None).
Price Bar Colors: Options to color price bars based on VSA patterns and volume levels.
Legend: Display a table of bar colors and levels for context and clarity of volume/spread bars.
Forecast: Configure forecast display and prediction details for volume and spread.
Average Multipliers: Define multipliers for different levels (Low, High, Ultra) to refine the analysis.
Moving Average: Set volume and spread moving average settings.
VSA: Select the VSA patterns to be calculated and displayed (Strength, Weakness, Neutral).
Bar Patterns: Criteria for bar patterns used in VSA (Doji, Bull Pin Bar, Bear Pin Bar, Spinning Top, Consolidation, High Wave).
Colors: Set exact colors used for indicator bars, indicator moving averages, and price bars.
More Display Options: Specify how VSA pattern text is displayed (Acronym, Descriptive), positioning, and sizes.
Alerts: Configure alerts for VSA patterns, volume, and spread levels, including forecasted levels.
█ Usage:
The Volume Spread Analysis indicator is a helpful tool for leveraging volume spread analysis to make informed trading decisions. It offers comprehensive visual and textual cues on the chart, making it easier to identify market conditions, potential reversals, and continuations. Whether analyzing historical data or forecasting future trends, this indicator provides insights into the underlying factors driving market movements.
インジケーター

Volume Spread Analysis [TANHEF]Volume Spread Analysis: Understanding Market Intentions through the Interpretation of Volume and Price Movements.
█ Simple Explanation:
The Volume Spread Analysis (VSA) indicator is a comprehensive tool that helps traders identify key market patterns and trends based on volume and spread data. This indicator highlights significant VSA patterns and provides insights into market behavior through color-coded volume/spread bars and identification of bars indicating strength, weakness, and neutrality between buyers and sellers. It also includes powerful volume and spread forecasting capabilities.
█ Laws of Volume Spread Analysis (VSA):
The origin of VSA begins with Richard Wyckoff, a pivotal figure in its development. Wyckoff made significant contributions to trading theory, including the formulation of three basic laws:
The Law of Supply and Demand: This fundamental law states that supply and demand balance each other over time. High demand and low supply lead to rising prices until demand falls to a level where supply can meet it. Conversely, low demand and high supply cause prices to fall until demand increases enough to absorb the excess supply.
The Law of Cause and Effect: This law assumes that a 'cause' will result in an 'effect' proportional to the 'cause'. A strong 'cause' will lead to a strong trend (effect), while a weak 'cause' will lead to a weak trend.
The Law of Effort vs. Result: This law asserts that the result should reflect the effort exerted. In trading terms, a large volume should result in a significant price move (spread). If the spread is small, the volume should also be small. Any deviation from this pattern is considered an anomaly.
█ Volume and Spread Analysis Bars:
Display: Volume and/or spread bars that consist of color coded levels. If both of these are displayed, the number of spread bars can be limited for visual appeal and understanding, with the spread bars scaled to match the volume bars. While automatic calculation of the number of visual bars for auto scaling is possible, it is avoided to prevent the indicator from reloading whenever the number of visual price bars on the chart is adjusted, ensuring uninterrupted analysis. A displayable table (Legend) of bar colors and levels can give context and clarify to each volume/spread bar.
Calculation: Levels are calculated using multipliers applied to moving averages to represent key levels based on historical data: low, normal, high, ultra. This method smooths out short-term fluctuations and focuses on longer-term trends.
Low Level: Indicates reduced volatility and market interest.
Normal Level: Reflects typical market activity and volatility.
High Level: Indicates increased activity and volatility.
Ultra Level: Identifies extreme levels of activity and volatility.
This illustrates the appearance of Volume and Spread bars when scaled and plotted together:
█ Forecasting Capabilities:
Display: Forecasted volume and spread levels using predictive models.
Calculation: Volume and Spread prediction calculations differ as volume is linear and spread is non-linear.
Volume Forecast (Linear Forecasting): Predicts future volume based on current volume rate and bar time till close.
Spread Forecast (Non-Linear Dynamic Forecasting): Predicts future spread using a dynamic multiplier, less near midpoint (consolidation) and more near low or high (trending), reflecting non-linear expansion.
Moving Averages: In forecasting, moving averages utilize forecasted levels instead of actual levels to ensure the correct level is forecasted (low, normal, high, or ultra).
The following compares forecasted volume with actual resulting volume, highlighting the power of early identifying increased volume through forecasted levels:
█ VSA Patterns:
Criteria and descriptions for each VSA pattern are available as tooltips beside them within the indicator’s settings. These tooltips provide explanations of potential developments based on the volume and spread data.
Signs of Strength (🟢): Patterns indicating strong buying pressure and potential market upturns.
Down Thrust
Selling Climax
No Effort → Bearish Result
Bearish Effort → No Result
Inverse Down Thrust
Failed Selling Climax
Bull Outside Reversal
End of Falling Market (Bag Holder)
Pseudo Down Thrust
No Supply
Signs of Weakness (🔴): Patterns indicating strong selling pressure and potential market downturns.
Up Thrust
Buying Climax
No Effort → Bullish Result
Bullish Effort → No Result
Inverse Up Thrust
Failed Buying Climax
Bear Outside Reversal
End of Rising Market (Bag Seller)
Pseudo Up Thrust
No Demand
Neutral Patterns (🔵): Patterns indicating market indecision and potential for continuation or reversal.
Quiet Doji
Balanced Doji
Strong Doji
Quiet Spinning Top
Balanced Spinning Top
Strong Spinning Top
Quiet High Wave
Balanced High Wave
Strong High Wave
Consolidation
Bar Patterns (🟡): Common candlestick patterns that offer insights into market sentiment. These are required in some VSA patterns and can also be displayed independently.
Bull Pin Bar
Bear Pin Bar
Doji
Spinning Top
High Wave
Consolidation
This demonstrates the acronym and descriptive options for displaying bar patterns, with the ability to hover over text to reveal the descriptive text along with what type of pattern:
█ Alerts:
VSA Pattern Alerts: Notifications for identified VSA patterns at bar close.
Volume and Spread Alerts: Alerts for confirmed and forecasted volume/spread levels (Low, High, Ultra).
Forecasted Volume and Spread Alerts: Alerts for forecasted volume/spread levels (High, Ultra) include a minimum percent time elapsed input to reduce false early signals by ensuring sufficient bar time has passed.
█ Inputs and Settings:
Display Volume and/or Spread: Choose between displaying volume bars, spread bars, or both with different lookback periods.
Indicator Bar Color: Select color schemes for bars (Normal, Detail, Levels).
Indicator Moving Average Color: Select schemes for bars (Fill, Lines, None).
Price Bar Colors: Options to color price bars based on VSA patterns and volume levels.
Legend: Display a table of bar colors and levels for context and clarity of volume/spread bars.
Forecast: Configure forecast display and prediction details for volume and spread.
Average Multipliers: Define multipliers for different levels (Low, High, Ultra) to refine the analysis.
Moving Average: Set volume and spread moving average settings.
VSA: Select the VSA patterns to be calculated and displayed (Strength, Weakness, Neutral).
Bar Patterns: Criteria for bar patterns used in VSA (Doji, Bull Pin Bar, Bear Pin Bar, Spinning Top, Consolidation, High Wave).
Colors: Set exact colors used for indicator bars, indicator moving averages, and price bars.
More Display Options: Specify how VSA pattern text is displayed (Acronym, Descriptive), positioning, and sizes.
Alerts: Configure alerts for VSA patterns, volume, and spread levels, including forecasted levels.
█ Usage:
The Volume Spread Analysis indicator is a helpful tool for leveraging volume spread analysis to make informed trading decisions. It offers comprehensive visual and textual cues on the chart, making it easier to identify market conditions, potential reversals, and continuations. Whether analyzing historical data or forecasting future trends, this indicator provides insights into the underlying factors driving market movements.
インジケーター

VolumeSpreadAnalysisLibrary "VolumeSpreadAnalysis"
A library for Volume Spread Analysis (VSA).
spread(_barIndex)
Calculates the spread of a bar.
Parameters:
_barIndex (int) : (int) The index of the bar.
Returns: (float) The spread of the bar.
volume(_barIndex)
Retrieves the volume of a bar.
Parameters:
_barIndex (int) : (int) The index of the bar.
Returns: (float) The volume of the bar.
body(_barIndex)
Calculates the body of a bar.
Parameters:
_barIndex (simple int) : (int) The index of the bar.
Returns: (float) The body size of the bar.
wickUpper(_barIndex)
Calculates the upper wick of a bar (upper shadow).
Parameters:
_barIndex (simple int) : (int) The index of the bar.
Returns: (float) The upper wick size of the bar.
wickLower(_barIndex)
Calculates the lower wick of a bar (lower shadow).
Parameters:
_barIndex (simple int) : (int) The index of the bar.
Returns: (float) The lower wick size of the bar.
calcForecastedSMA(_source, _length, _forecastedLevel)
Calculates the forecasted Simple Moving Average (SMA).
Parameters:
_source (float) : (series float) Source data for calculation.
_length (simple int) : (int) The length of the SMA.
_forecastedLevel (float) : (float) The forecasted level to include in the calculation.
Returns: (float) The forecasted SMA value.
calcForecastedEMA(_source, _length, _forecastedLevel)
Calculates the forecasted Exponential Moving Average (EMA).
Parameters:
_source (float) : (series float) Source data for calculation.
_length (simple int) : (int) The length of the EMA.
_forecastedLevel (float) : (float) The forecasted level to include in the calculation.
Returns: (float) The forecasted EMA value.
calcForecastedRMA(_source, _length, _forecastedLevel)
Calculates the forecasted Relative Moving Average (RMA).
Parameters:
_source (float) : (series float) Source data for calculation.
_length (simple int) : (int) The length of the RMA.
_forecastedLevel (float) : (float) The forecasted level to include in the calculation.
Returns: (float) The forecasted RMA value.
calcForecastedWMA(_source, _length, _forecastedLevel)
Calculates the forecasted Weighted Moving Average (WMA).
Parameters:
_source (float) : (series float) Source data for calculation.
_length (simple int) : (int) The length of the WMA.
_forecastedLevel (float) : (float) The forecasted level to include in the calculation.
Returns: (float) The forecasted WMA value.
calcElapsedTimePercent()
Calculates the elapsed time percent of the current bar.
Returns: (float) The elapsed time percent.
calcForecastedSpread(multiplierAtMidpoints, multiplierAtPeaks)
Calculates the forecasted spread using elapsed time and dynamic multipliers, handling spread's non-linear nature.
Parameters:
multiplierAtMidpoints (float) : (float) The multiplier value at midpoints.
multiplierAtPeaks (float) : (float) The multiplier value at peaks.
Returns: (float) The forecasted spread value.
calcForecastedVolume()
Calculates the forecasted volume using elapsed time, satisfying volume's linear nature.
Returns: (float) The forecasted volume value.
calcForecastedMA(_source, _length, _forecastedSource, _type)
Calculates the forecasted Moving Average (MA) based on the specified type.
Parameters:
_source (float) : (series float) Source data for calculation.
_length (simple int) : (int) The length of the MA.
_forecastedSource (float) : (float) The forecasted level to include in the calculation.
_type (simple string) : (string) The type of the MA ("SMA", "EMA", "SMMA (RMA)", "WMA").
Returns: (float) The forecasted MA value.
calcMA(_source, _length, _type)
Calculates the Moving Average (MA) based on the specified type.
Parameters:
_source (float) : (series float) Source data for calculation.
_length (simple int) : (int) The length of the MA.
_type (simple string) : (string) The type of the MA ("SMA", "EMA", "SMMA (RMA)", "WMA").
Returns: (float) The MA value.
bullBar(_barIndex)
Determines if the bar is bullish.
Parameters:
_barIndex (simple int) : (int) The index of the bar.
Returns: (bool) True if the bar is bullish, otherwise false.
bearBar(_barIndex)
Determines if the bar is bearish.
Parameters:
_barIndex (simple int) : (int) The index of the bar.
Returns: (bool) True if the bar is bearish, otherwise false.
breakout(_barIndex)
Determines if there is a breakout above the previous bar.
Parameters:
_barIndex (simple int) : (int) The index of the bar.
Returns: (bool) True if there is a breakout, otherwise false.
breakdown(_barIndex)
Determines if there is a breakdown below the previous bar.
Parameters:
_barIndex (simple int) : (int) The index of the bar.
Returns: (bool) True if there is a breakdown, otherwise false.
rejectionWickUpper(_rejectionWick)
Determines if the upper wick is a rejection wick.
Parameters:
_rejectionWick (simple float) : (float) The rejection wick percentage.
Returns: (bool) True if the upper wick is a rejection wick, otherwise false.
rejectionWickLower(_rejectionWick)
Determines if the lower wick is a rejection wick.
Parameters:
_rejectionWick (simple float) : (float) The rejection wick percentage.
Returns: (bool) True if the lower wick is a rejection wick, otherwise false.
setupDataVolume(_data, _mult_Low, _mult_High, _mult_Ultra, _maLengthVolume, _maTypeVolume)
Sets up data for volume levels.
Parameters:
_data (map) : (map) The map to store the levels.
_mult_Low (simple float) : (float) The multiplier for low level.
_mult_High (simple float) : (float) The multiplier for high level.
_mult_Ultra (simple float) : (float) The multiplier for ultra level.
_maLengthVolume (simple int) : (int) The length for MA.
_maTypeVolume (simple string) : (string) The type for MA.
Returns: (void) Nothing.
setupDataSpread(_data, _mult_Low, _mult_High, _mult_Ultra, _maLengthSpread, _maTypeSpread)
Sets up data for spread levels.
Parameters:
_data (map) : (map) The map to store the levels.
_mult_Low (simple float) : (float) The multiplier for low level.
_mult_High (simple float) : (float) The multiplier for high level.
_mult_Ultra (simple float) : (float) The multiplier for ultra level.
_maLengthSpread (simple int) : (int) The length for MA.
_maTypeSpread (simple string) : (string) The type for MA.
Returns: (void) Nothing.
setupDataForecastVolume(_dataForecast, _mult_Low, _mult_High, _mult_Ultra, _maLengthVolume, _predictedLevelVolume, _maTypeVolume)
Sets up data for volume and spread levels for forecast.
Parameters:
_dataForecast (map)
_mult_Low (simple float) : (float) The multiplier for low level.
_mult_High (simple float) : (float) The multiplier for high level.
_mult_Ultra (simple float) : (float) The multiplier for ultra level.
_maLengthVolume (simple int) : (int) The length for MA.
_predictedLevelVolume (float) : (float) The predicted level for MA.
_maTypeVolume (simple string) : (string) The type for MA.
Returns: (void) Nothing.
setupDataForecastSpread(_dataForecast, _mult_Low, _mult_High, _mult_Ultra, _maLengthSpread, _predictedLevelSpread, _maTypeSpread)
Sets up data for spread levels for forecast.
Parameters:
_dataForecast (map)
_mult_Low (simple float) : (float) The multiplier for low level.
_mult_High (simple float) : (float) The multiplier for high level.
_mult_Ultra (simple float) : (float) The multiplier for ultra level.
_maLengthSpread (simple int) : (int) The length for MA.
_predictedLevelSpread (float) : (float) The predicted level for MA.
_maTypeSpread (simple string) : (string) The type for MA.
Returns: (void) Nothing.
isVolumeLow(_data, _barIndex)
Determines if the volume is low.
Parameters:
_data (map) : (map) The data map with volume levels.
_barIndex (int)
Returns: (bool) True if the volume is low, otherwise false.
isVolumeNormal(_data, _barIndex)
Determines if the volume is normal.
Parameters:
_data (map) : (map) The data map with volume levels.
_barIndex (int)
Returns: (bool) True if the volume is normal, otherwise false.
isVolumeHigh(_data, _barIndex)
Determines if the volume is high.
Parameters:
_data (map) : (map) The data map with volume levels.
_barIndex (int)
Returns: (bool) True if the volume is high, otherwise false.
isVolumeUltra(_data, _barIndex)
Determines if the volume is ultra.
Parameters:
_data (map) : (map) The data map with volume levels.
_barIndex (int)
Returns: (bool) True if the volume is ultra, otherwise false.
isSpreadLow(_data, _barIndex)
Determines if the spread is low.
Parameters:
_data (map) : (map) The data map with spread levels.
_barIndex (int)
Returns: (bool) True if the spread is low, otherwise false.
isSpreadNormal(_data, _barIndex)
Determines if the spread is normal.
Parameters:
_data (map) : (map) The data map with spread levels.
_barIndex (int)
Returns: (bool) True if the spread is normal, otherwise false.
isSpreadHigh(_data, _barIndex)
Determines if the spread is high.
Parameters:
_data (map) : (map) The data map with spread levels.
_barIndex (int)
Returns: (bool) True if the spread is high, otherwise false.
isSpreadUltra(_data, _barIndex)
Determines if the spread is ultra.
Parameters:
_data (map) : (map) The data map with spread levels.
_barIndex (int)
Returns: (bool) True if the spread is ultra, otherwise false.
isVolumeText(_data)
Determines text string representing the volume area level.
Parameters:
_data (map) : (map) The data map with volume levels.
Returns: (string) Text string of Low, Normal, High, or Ultra.
isSpreadText(_data)
Determines text string representing the spread area level.
Parameters:
_data (map) : (map) The data map with spread levels.
Returns: (string) Text string of Low, Normal, High, or Ultra.
calcBarColor(_value, _level)
Calculates the color based level.
Parameters:
_value (float) : (float) The value to check.
_level (float) : (float) The value level for comparison.
Returns: (color) The color for the bar.
bullPinBar(_maxBodyPercent, _minWickPercent)
Determines if the bar is a bull pin bar.
Parameters:
_maxBodyPercent (simple float) : (float) The maximum body percentage.
_minWickPercent (simple float) : (float) The minimum wick percentage.
Returns: (bool) True if the bar is a bull pin bar, otherwise false.
bearPinBar(_maxBodyPercent, _minWickPercent)
Determines if the bar is a bear pin bar.
Parameters:
_maxBodyPercent (simple float) : (float) The maximum body percentage.
_minWickPercent (simple float) : (float) The minimum wick percentage.
Returns: (bool) True if the bar is a bear pin bar, otherwise false.
dojiBar(_maxBodyPercent)
Determines if the bar is a doji.
Parameters:
_maxBodyPercent (simple float) : (float) The maximum body percentage.
Returns: (bool) True if the bar is a doji, otherwise false.
spinningTopBar(_minWicksPercent, _emaLength)
Determines if the bar is a spinning top.
Parameters:
_minWicksPercent (simple float) : (float) The minimum wicks percentage.
_emaLength (simple int) : (int) The length for EMA calculation.
Returns: (bool) True if the bar is a spinning top, otherwise false.
highWaveBar(_minBodyPercent, _minWickPercent, _bars)
Determines if the bar is a high wave bar.
Parameters:
_minBodyPercent (simple float) : (float) The minimum body percentage.
_minWickPercent (simple float) : (float) The minimum wick percentage.
_bars (simple int) : (int) The number of bars for comparison.
Returns: (bool) True if the bar is a high wave bar, otherwise false.
consolidationBar(_data, _spread, _bars)
Determines if the bars are in consolidation.
Parameters:
_data (map) : (map) The data map with spread levels.
_spread (simple float) : (float) The spread percentage for comparison.
_bars (simple int) : (int) The number of bars for comparison.
Returns: (bool) True if the bars are in consolidation, otherwise false.
S_DownThrust(_data, _bullPinBarMaxBody, _bullPinBarMinWick)
Determines if there is a sign of strength (DownThrust).
Parameters:
_data (map) : (map) The data map with volume and spread levels.
_bullPinBarMaxBody (simple float) : (float) The maximum body percentage for bull pin bar.
_bullPinBarMinWick (simple float) : (float) The minimum wick percentage for bull pin bar.
Returns: (bool) True if there is a sign of strength (DownThrust), otherwise false.
S_SellingClimax(_data, _rejectionWick)
Determines if there is a sign of strength (Selling Climax).
Parameters:
_data (map) : (map) The data map with volume and spread levels.
_rejectionWick (simple float) : (float) The rejection wick percentage.
Returns: (bool) True if there is a sign of strength (Selling Climax), otherwise false.
S_NoEffortBearishResult()
Determines if there is a sign of strength (No Effort Bearish Result).
Returns: (bool) True if there is a sign of strength (No Effort Bearish Result), otherwise false.
S_BearishEffortNoResult()
Determines if there is a sign of strength (Bearish Effort No Result).
Returns: (bool) True if there is a sign of strength (Bearish Effort No Result), otherwise false.
S_InverseDownThrust(_data, _bearPinBarMaxBody, _bearPinBarMinWick)
Determines if there is a sign of strength (Inverse DownThrust).
Parameters:
_data (map) : (map) The data map with volume and spread levels.
_bearPinBarMaxBody (simple float) : (float) The maximum body percentage for bear pin bar.
_bearPinBarMinWick (simple float) : (float) The minimum wick percentage for bear pin bar.
Returns: (bool) True if there is a sign of strength (Inverse DownThrust), otherwise false.
S_FailedSellingClimax()
Determines if there is a sign of strength (Failed Selling Climax).
Returns: (bool) True if there is a sign of strength (Failed Selling Climax), otherwise false.
S_BullOutsideReversal(_data)
Determines if there is a sign of strength (Bull Outside Reversal).
Parameters:
_data (map) : (map) The data map with volume and spread levels.
Returns: (bool) True if there is a sign of strength (Bull Outside Reversal), otherwise false.
S_EndOfFallingMarket(_data)
Determines if there is a sign of strength (End of Falling Market).
Parameters:
_data (map) : (map) The data map with volume and spread levels.
Returns: (bool) True if there is a sign of strength (End of Falling Market), otherwise false.
S_PseudoDownThrust(_bullPinBarMaxBody, _bullPinBarMinWick)
Determines if there is a sign of strength (Pseudo DownThrust).
Parameters:
_bullPinBarMaxBody (simple float) : (float) The maximum body percentage for bull pin bar.
_bullPinBarMinWick (simple float) : (float) The minimum wick percentage for bull pin bar.
Returns: (bool) True if there is a sign of strength (Pseudo DownThrust), otherwise false.
S_NoSupply(_bullPinBarMaxBody, _bullPinBarMinWick)
Determines if there is a sign of strength (No Supply).
Parameters:
_bullPinBarMaxBody (simple float) : (float) The maximum body percentage for bull pin bar.
_bullPinBarMinWick (simple float) : (float) The minimum wick percentage for bull pin bar.
Returns: (bool) True if there is a sign of strength (No Supply), otherwise false.
W_UpThrust(_data, _bearPinBarMaxBody, _bearPinBarMinWick)
Determines if there is a sign of weakness (UpThrust).
Parameters:
_data (map) : (map) The data map with volume and spread levels.
_bearPinBarMaxBody (simple float) : (float) The maximum body percentage for bear pin bar.
_bearPinBarMinWick (simple float) : (float) The minimum wick percentage for bear pin bar.
Returns: (bool) True if there is a sign of weakness (UpThrust), otherwise false.
W_BuyingClimax(_data, _rejectionWick)
Determines if there is a sign of weakness (Buying Climax).
Parameters:
_data (map) : (map) The data map with volume and spread levels.
_rejectionWick (simple float) : (float) The rejection wick percentage.
Returns: (bool) True if there is a sign of weakness (Buying Climax), otherwise false.
W_NoEffortBullishResult()
Determines if there is a sign of weakness (No Effort Bullish Result).
Returns: (bool) True if there is a sign of weakness (No Effort Bullish Result), otherwise false.
W_BullishEffortNoResult()
Determines if there is a sign of weakness (Bullish Effort No Result).
Returns: (bool) True if there is a sign of weakness (Bullish Effort No Result), otherwise false.
W_InverseUpThrust(_data, _bullPinBarMaxBody, _bullPinBarMinWick)
Determines if there is a sign of weakness (Inverse UpThrust).
Parameters:
_data (map) : (map) The data map with volume and spread levels.
_bullPinBarMaxBody (simple float) : (float) The maximum body percentage for bull pin bar.
_bullPinBarMinWick (simple float) : (float) The minimum wick percentage for bull pin bar.
Returns: (bool) True if there is a sign of weakness (Inverse UpThrust), otherwise false.
W_FailedBuyingClimax()
Determines if there is a sign of weakness (Failed Buying Climax).
Returns: (bool) True if there is a sign of weakness (Failed Buying Climax), otherwise false.
W_BearOutsideReversal(_data)
Determines if there is a sign of weakness (Bear Outside Reversal).
Parameters:
_data (map) : (map) The data map with volume and spread levels.
Returns: (bool) True if there is a sign of weakness (Bear Outside Reversal), otherwise false.
W_EndOfRisingMarket(_data)
Determines if there is a sign of weakness (End of Rising Market).
Parameters:
_data (map) : (map) The data map with volume and spread levels.
Returns: (bool) True if there is a sign of weakness (End of Rising Market), otherwise false.
W_PseudoUpThrust(_bearPinBarMaxBody, _bearPinBarMinWick)
Determines if there is a sign of weakness (Pseudo UpThrust).
Parameters:
_bearPinBarMaxBody (simple float) : (float) The maximum body percentage for bear pin bar.
_bearPinBarMinWick (simple float) : (float) The minimum wick percentage for bear pin bar.
Returns: (bool) True if there is a sign of weakness (Pseudo UpThrust), otherwise false.
W_NoDemand(_bearPinBarMaxBody, _bearPinBarMinWick)
Determines if there is a sign of weakness (No Demand).
Parameters:
_bearPinBarMaxBody (simple float) : (float) The maximum body percentage for bear pin bar.
_bearPinBarMinWick (simple float) : (float) The minimum wick percentage for bear pin bar.
Returns: (bool) True if there is a sign of weakness (No Demand), otherwise false.
N_QuietDoji(_dojiBarMaxBody)
Determines if there is a neutral signal (Quiet Doji).
Parameters:
_dojiBarMaxBody (simple float) : (float) The maximum body percentage for doji bar.
Returns: (bool) True if there is a neutral signal (Quiet Doji), otherwise false.
N_BalancedDoji(_data, _dojiBarMaxBody)
Determines if there is a neutral signal (Balanced Doji).
Parameters:
_data (map) : (map) The data map with volume and spread levels.
_dojiBarMaxBody (simple float) : (float) The maximum body percentage for doji bar.
Returns: (bool) True if there is a neutral signal (Balanced Doji), otherwise false.
N_StrongDoji(_dojiBarMaxBody)
Determines if there is a neutral signal (Strong Doji).
Parameters:
_dojiBarMaxBody (simple float) : (float) The maximum body percentage for doji bar.
Returns: (bool) True if there is a neutral signal (Strong Doji), otherwise false.
N_QuietSpinningTop(_spinningTopBarMinWicks, _spinningTopBarEmaLength)
Determines if there is a neutral signal (Quiet Spinning Top).
Parameters:
_spinningTopBarMinWicks (simple float) : (float) The minimum wicks percentage for spinning top bar.
_spinningTopBarEmaLength (simple int) : (int) The length for EMA calculation.
Returns: (bool) True if there is a neutral signal (Quiet Spinning Top), otherwise false.
N_BalancedSpinningTop(_data, _spinningTopBarMinWicks, _spinningTopBarEmaLength)
Determines if there is a neutral signal (Balanced Spinning Top).
Parameters:
_data (map) : (map) The data map with volume and spread levels.
_spinningTopBarMinWicks (simple float) : (float) The minimum wicks percentage for spinning top bar.
_spinningTopBarEmaLength (simple int) : (int) The length for EMA calculation.
Returns: (bool) True if there is a neutral signal (Balanced Spinning Top), otherwise false.
N_StrongSpinningTop(_spinningTopBarMinWicks, _spinningTopBarEmaLength)
Determines if there is a neutral signal (Strong Spinning Top).
Parameters:
_spinningTopBarMinWicks (simple float) : (float) The minimum wicks percentage for spinning top bar.
_spinningTopBarEmaLength (simple int) : (int) The length for EMA calculation.
Returns: (bool) True if there is a neutral signal (Strong Spinning Top), otherwise false.
N_QuietHighWave(_highWaveBarMinBody, _highWaveBarMinWick, _highWaveBarBars)
Determines if there is a neutral signal (Quiet High Wave).
Parameters:
_highWaveBarMinBody (simple float) : (float) The minimum body percentage for high wave bar.
_highWaveBarMinWick (simple float) : (float) The minimum wick percentage for high wave bar.
_highWaveBarBars (simple int) : (int) The number of bars for comparison.
Returns: (bool) True if there is a neutral signal (Quiet High Wave), otherwise false.
N_BalancedHighWave(_data, _highWaveBarMinBody, _highWaveBarMinWick, _highWaveBarBars)
Determines if there is a neutral signal (Balanced High Wave).
Parameters:
_data (map) : (map) The data map with volume and spread levels.
_highWaveBarMinBody (simple float) : (float) The minimum body percentage for high wave bar.
_highWaveBarMinWick (simple float) : (float) The minimum wick percentage for high wave bar.
_highWaveBarBars (simple int) : (int) The number of bars for comparison.
Returns: (bool) True if there is a neutral signal (Balanced High Wave), otherwise false.
N_StrongHighWave(_highWaveBarMinBody, _highWaveBarMinWick, _highWaveBarBars)
Determines if there is a neutral signal (Strong High Wave).
Parameters:
_highWaveBarMinBody (simple float) : (float) The minimum body percentage for high wave bar.
_highWaveBarMinWick (simple float) : (float) The minimum wick percentage for high wave bar.
_highWaveBarBars (simple int) : (int) The number of bars for comparison.
Returns: (bool) True if there is a neutral signal (Strong High Wave), otherwise false.
N_Consolidation(_data, _consolidationBarSpread, _consolidationBarBars)
Determines if there is a neutral signal (Consolidation).
Parameters:
_data (map) : (map) The data map with volume and spread levels.
_consolidationBarSpread (simple float) : (float) The spread percentage for consolidation bar.
_consolidationBarBars (simple int) : (int) The number of bars for comparison.
Returns: (bool) True if there is a neutral signal (Consolidation), otherwise false. ライブラリ

sVPSA - standardized Volume Price Spread AnalysisDear Analysts and Traders,
I want to introduce my new indicator - sVPSA - standardized Volume Price Spread Analysis. For me, this script is helpfully in Technical Analysis mainly with Wyckoff and VSA methodologies. Maybe You are in circle of people who used my previous script - normalized Volume Price Spread Analysis. I work with him a lot of time, but I come to a conclusion that I can do better...
Theory concept...
What is a big volume? How big was this spread? It was extreme high or just high? How to do an answer for this and a lot other questions related to this subject? My thoughts was directed to statistics. In my first script I used to x/max normalized data. It was good, but susceptible for high deviation events. So, I choose standardization method with smaller sensitivity on violent events - z-Score standardization Description of z-Score formula:
Z = (x-mean)/standard deviation
Probability of event are descriptive by probability density function - The Normal Distribution.
en.wikipedia.org
en.Wikipedia.org
This is base of script methodology, let’s go deeper in indicator.
X axis is time, date. Y axis is standard deviation. Narrow bar represent price spread, wide one is volume. Colors are corresponding to deviation, blue < sigma, green > sigma, red > 2*sigma and fuchsia > 3*sigma. Appearance is full editable.
Data collection starts from left to right. There is two possibilities to use, constans number of bars or visible data range, also indicator permit to overscore linear regression from data. There is a possibility to set an alert.
Short introduction how put an interpretation on visualized data.
For this example I used constans value of data collection, 52 bars. So, from left I see great, fuchsia volume bar with low spread. This record respond Celsius withdrawals pause. This is bar with the biggest volume on presented chart, more than four sigmas. Spread value is near one sigma. I should consider this via one of Wyckoffs laws - effort vs result. I see a three bars in turn, they tenor tells me that bear market is possible near end. Accumulation structure near new year, spring test and bullish momentum bar near march are approval of this idea. Next high spread bars have volume near mean value. Effort is low but result is great. Interesting is last bar, with -2,8 deviation of volume. I see the lowest volume value on chart, so he’s deviation is strong to negative side. This script require a little of practise and can be a potent tool in Technical Analysis.
If You have a concept how to improve my script or You experience bug, please, send me feedback.
I hope that You consider my work as useful.
I wish You great trades and faultless analysis.
CatTheTrader
インジケーター

インジケーター