INVITE-ONLY SCRIPT
FDDM [ Shervinfx ]
( Fractal Dimensions and the Depth Manipulation )
1.With this indicator, you can properly understand fractal dimensions and the depth of market manipulation.Fddm identifies regions daily to measure fractal dimensions and assess data for market manipulation.
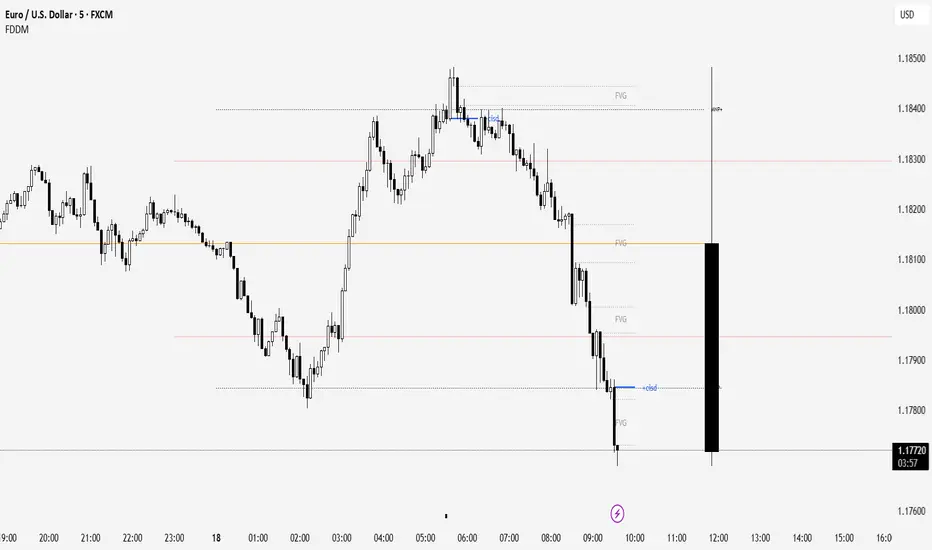
2.The red and blue areas in the image indicate the regions where the fractal dimensions are measured.
The MNP - or + and MNP5 areas are the market manipulation zones that arise daily with different market profiles.
3.Please apply the FDDM indicator settings exactly as shown in the pictures I shared to ensure correct usage and avoid any violations, so you can get the best results and positive responses in your trades.
4.There are two types of tables to view the Fractal dimension prices and market manipulation that we observe as MNP, so you can make the best trading decisions and achieve success at your entry points.
5.The higher timeframe candle is considered for you so you can combine the market OHLC-OLHC with your lower-fractal timeframe. This way, your entry precision increases, and you have quick access to higher timeframes even with just a laptop and a monitor; you don’t need other monitors when using the FDDM indicator.
6.Change in state of delivery" is one of the key ways to consider market shift in both lower and higher timeframes. You should pay close attention to MNP and FD points at price touch and trend, so you enter at the right price level. This itself is an important confirmation for entering a trade, and the FDDM indicator does this automatically for you across all timeframes accurately, since recognizing CISD can be very challenging at times.
7.Identify fair value gaps (FVG) automatically and plot them on the chart without any effort. The FDDM indicator does this for you, and you can set the number of gaps to display in the settings. This is a great boon for traders, allowing you to focus purely on trading and entries, stay away from peripheral tasks, enjoy the trading process, and reap substantial profits.
8.I have to tell you about a kind of miracle: since FD and MNP form a single zone for us, if this zone is shadowed or has a solid test, we can execute a good entry. If the market trend is intact but this zone is touched by the body and the market turns, you should wait for CISD to achieve the best, low-risk entry for trend reversals or corrections. Based on narrative and bias, you can make good trading decisions.
1.With this indicator, you can properly understand fractal dimensions and the depth of market manipulation.Fddm identifies regions daily to measure fractal dimensions and assess data for market manipulation.
2.The red and blue areas in the image indicate the regions where the fractal dimensions are measured.
The MNP - or + and MNP5 areas are the market manipulation zones that arise daily with different market profiles.
3.Please apply the FDDM indicator settings exactly as shown in the pictures I shared to ensure correct usage and avoid any violations, so you can get the best results and positive responses in your trades.
4.There are two types of tables to view the Fractal dimension prices and market manipulation that we observe as MNP, so you can make the best trading decisions and achieve success at your entry points.
5.The higher timeframe candle is considered for you so you can combine the market OHLC-OLHC with your lower-fractal timeframe. This way, your entry precision increases, and you have quick access to higher timeframes even with just a laptop and a monitor; you don’t need other monitors when using the FDDM indicator.
6.Change in state of delivery" is one of the key ways to consider market shift in both lower and higher timeframes. You should pay close attention to MNP and FD points at price touch and trend, so you enter at the right price level. This itself is an important confirmation for entering a trade, and the FDDM indicator does this automatically for you across all timeframes accurately, since recognizing CISD can be very challenging at times.
7.Identify fair value gaps (FVG) automatically and plot them on the chart without any effort. The FDDM indicator does this for you, and you can set the number of gaps to display in the settings. This is a great boon for traders, allowing you to focus purely on trading and entries, stay away from peripheral tasks, enjoy the trading process, and reap substantial profits.
8.I have to tell you about a kind of miracle: since FD and MNP form a single zone for us, if this zone is shadowed or has a solid test, we can execute a good entry. If the market trend is intact but this zone is touched by the body and the market turns, you should wait for CISD to achieve the best, low-risk entry for trend reversals or corrections. Based on narrative and bias, you can make good trading decisions.
招待専用スクリプト
こちらのスクリプトにアクセスできるのは投稿者が承認したユーザーだけです。投稿者にリクエストして使用許可を得る必要があります。通常の場合、支払い後に許可されます。詳細については、以下、作者の指示をお読みになるか、Shervin-fxに直接ご連絡ください。
スクリプトの機能を理解し、その作者を全面的に信頼しているのでなければ、お金を支払ってまでそのスクリプトを利用することをTradingViewとしては「非推奨」としています。コミュニティスクリプトの中で、その代わりとなる無料かつオープンソースのスクリプトを見つけられる可能性もあります。
作者の指示
For quick and easy access, you can join the Telegram channel via the link below and request access by sending a direct message on Telegram.
Telegram :
https://t.me/shervin_indicators
免責事項
これらの情報および投稿は、TradingViewが提供または保証する金融、投資、取引、またはその他の種類のアドバイスや推奨を意図したものではなく、またそのようなものでもありません。詳しくは利用規約をご覧ください。