PROTECTED SOURCE SCRIPT
Impulse Reversal + EMAs

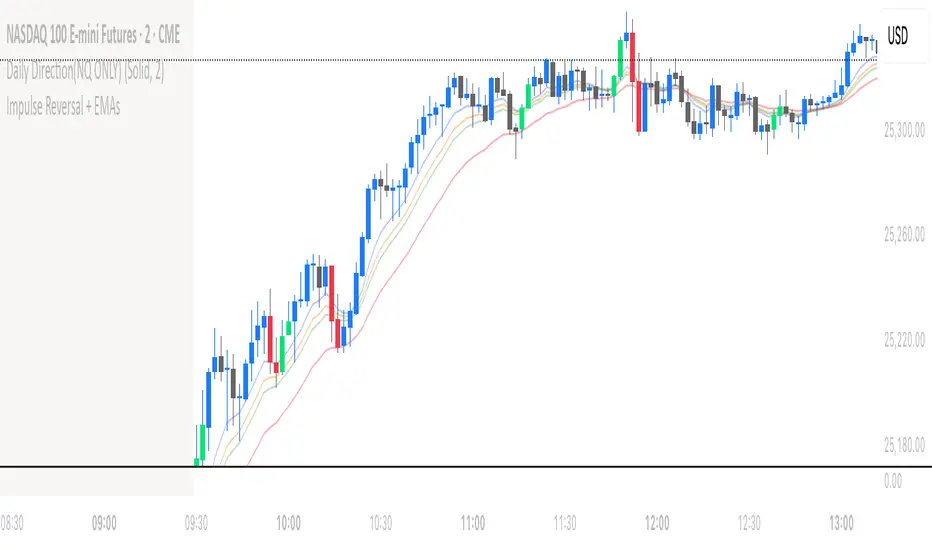
The Impulse Reversal indicator highlights key moments when momentum shifts sharply in the market.
It detects two opposite patterns:
• 🟩 Bullish Impulse: When a bearish candle is followed by a stronger bullish candle and another bullish confirmation, both bullish candles turn lime green, signaling potential upward momentum.
• 🟥 Bearish Impulse: When a bullish candle is followed by a stronger bearish candle and another bearish confirmation, both bearish candles turn red, indicating potential downward momentum.
At the same time, four EMA lines (8, 11, 13, and 21 by default) appear to help confirm the trend direction.
When all EMAs align and the impulsive color signal appears, it visually identifies high-probability reversal or continuation zones on the chart.
保護スクリプト
このスクリプトのソースコードは非公開で投稿されています。 しかし、無料かつ制限なしでご利用いただけます ― 詳細についてはこちらをご覧ください。
免責事項
これらの情報および投稿は、TradingViewが提供または保証する金融、投資、取引、またはその他の種類のアドバイスや推奨を意図したものではなく、またそのようなものでもありません。詳しくは利用規約をご覧ください。
保護スクリプト
このスクリプトのソースコードは非公開で投稿されています。 しかし、無料かつ制限なしでご利用いただけます ― 詳細についてはこちらをご覧ください。
免責事項
これらの情報および投稿は、TradingViewが提供または保証する金融、投資、取引、またはその他の種類のアドバイスや推奨を意図したものではなく、またそのようなものでもありません。詳しくは利用規約をご覧ください。