PROTECTED SOURCE SCRIPT
Short TimeFrame MAs with momentum clouds
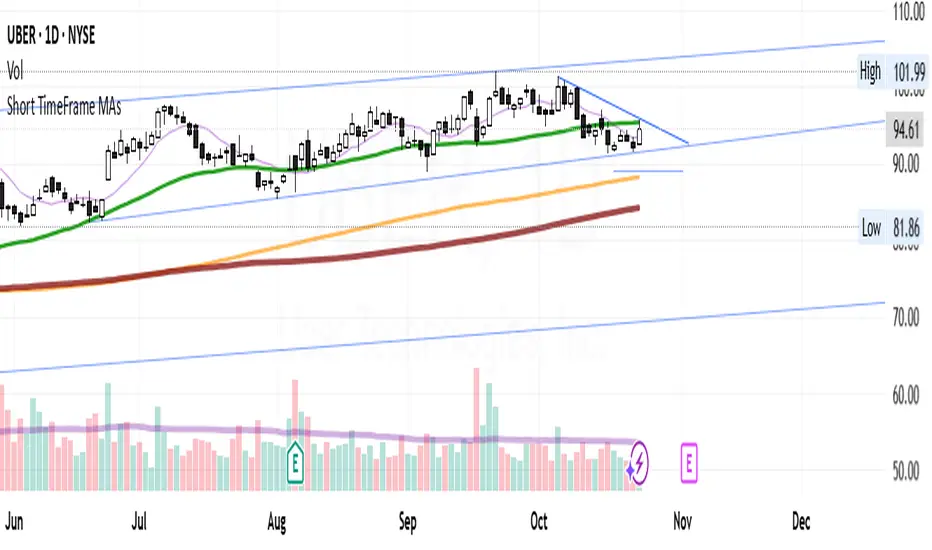
This indicator displays multiple moving averages to help identify short- and mid-term trends.
It includes four SMAs (9, 50, 150, 200) and two EMAs (21, 55) with color changes showing bullish or bearish momentum.
The area between the EMAs is filled to highlight trend direction.
An optional smoothing layer lets you apply different MA types or Bollinger Bands for additional clarity.
It’s designed to give a clear visual of overall trend strength, direction, and volatility on any timeframe.
保護スクリプト
このスクリプトのソースコードは非公開で投稿されています。 ただし、制限なく自由に使用できます – 詳細はこちらでご確認ください。
免責事項
この情報および投稿は、TradingViewが提供または推奨する金融、投資、トレード、その他のアドバイスや推奨を意図するものではなく、それらを構成するものでもありません。詳細は利用規約をご覧ください。
免責事項
この情報および投稿は、TradingViewが提供または推奨する金融、投資、トレード、その他のアドバイスや推奨を意図するものではなく、それらを構成するものでもありません。詳細は利用規約をご覧ください。