INVITE-ONLY SCRIPT
更新済 Killpips Acceleration
Dynamic action levels for tracking market reaction zones using a proprietary algorithm.
Settings
The acceleration value is automatically calculated every day. For a custom acceleration value, you can adjust it in the settings. Custom settings may be shared on the discord server if warranted. Setting this value to zero enables the auto-calculation.
Using the Indicator
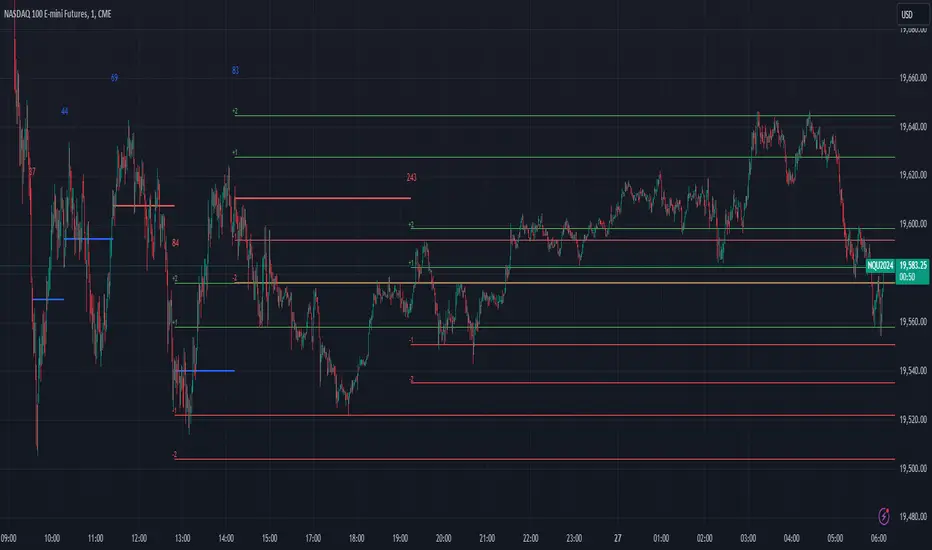
As data is received, the indicators adjusts it's calculation for the next action levels. Once the calculation is complete, a horizontal line is drawn as a decision price level. ATR levels are wrapped around the decision price level for additional reaction levels. As price approaches these levels, be cautious with your entries and exits while looking for price reactions. The calculated horizontal line can represent both support and resistance.
The shorter the calculated horizontal line, the stronger the reaction zone. As horizontal lines shift to higher prices, it indicates long market interest. Shorter lines with increasing price levels indicates a strong correlation to price change.
Generally, near the end of a segment, especially shorter segments, as the calculated horizontal line is drawn, we're looking for a market reaction.
Longer segments represent a slowdown in market activity with less reaction.
Settings
The acceleration value is automatically calculated every day. For a custom acceleration value, you can adjust it in the settings. Custom settings may be shared on the discord server if warranted. Setting this value to zero enables the auto-calculation.
Using the Indicator
As data is received, the indicators adjusts it's calculation for the next action levels. Once the calculation is complete, a horizontal line is drawn as a decision price level. ATR levels are wrapped around the decision price level for additional reaction levels. As price approaches these levels, be cautious with your entries and exits while looking for price reactions. The calculated horizontal line can represent both support and resistance.
The shorter the calculated horizontal line, the stronger the reaction zone. As horizontal lines shift to higher prices, it indicates long market interest. Shorter lines with increasing price levels indicates a strong correlation to price change.
Generally, near the end of a segment, especially shorter segments, as the calculated horizontal line is drawn, we're looking for a market reaction.
Longer segments represent a slowdown in market activity with less reaction.
リリースノート
Added the ability to customize the color and styles招待専用スクリプト
このスクリプトは作者が承認したユーザーのみアクセス可能です。使用するにはアクセス申請をして許可を得る必要があります。通常は支払い後に承認されます。詳細は下記の作者の指示に従うか、wmarkwilkinsonに直接お問い合わせください。
このプライベートの招待専用スクリプトはモデレーターによる審査を受けておらず、ハウスルールへの準拠状況は未確認です。 TradingViewは、作者を完全に信頼し、スクリプトの動作を理解していない限り、有料スクリプトの購入・使用を推奨しません。コミュニティスクリプトには無料のオープンソースの代替が多数あります。
作者の指示
This indicator is available for members of the discord server.
免責事項
この情報および投稿は、TradingViewが提供または推奨する金融、投資、トレード、その他のアドバイスや推奨を意図するものではなく、それらを構成するものでもありません。詳細は利用規約をご覧ください。
招待専用スクリプト
このスクリプトは作者が承認したユーザーのみアクセス可能です。使用するにはアクセス申請をして許可を得る必要があります。通常は支払い後に承認されます。詳細は下記の作者の指示に従うか、wmarkwilkinsonに直接お問い合わせください。
このプライベートの招待専用スクリプトはモデレーターによる審査を受けておらず、ハウスルールへの準拠状況は未確認です。 TradingViewは、作者を完全に信頼し、スクリプトの動作を理解していない限り、有料スクリプトの購入・使用を推奨しません。コミュニティスクリプトには無料のオープンソースの代替が多数あります。
作者の指示
This indicator is available for members of the discord server.
免責事項
この情報および投稿は、TradingViewが提供または推奨する金融、投資、トレード、その他のアドバイスや推奨を意図するものではなく、それらを構成するものでもありません。詳細は利用規約をご覧ください。