INVITE-ONLY SCRIPT
ADX histogram with SMA
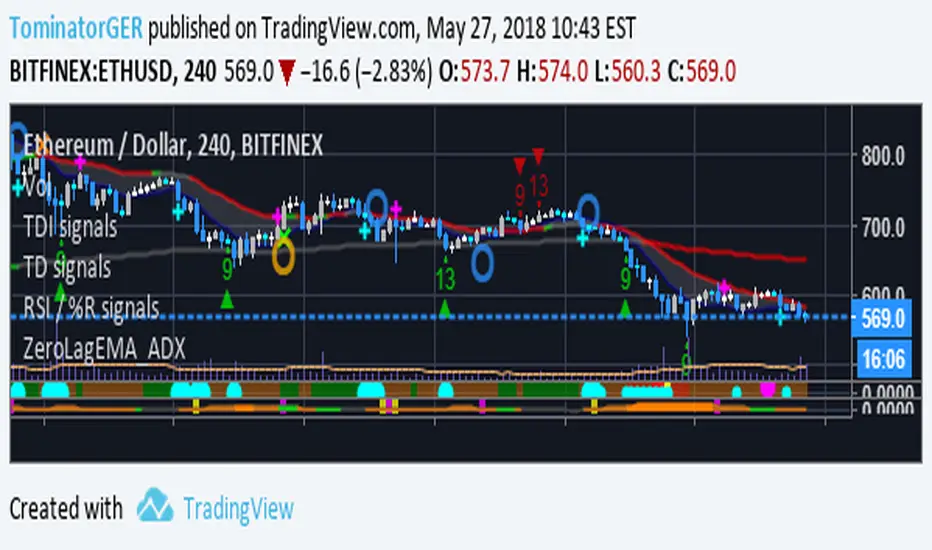
This indicator shows a histogram of the ADX with the following colors:
Additionally i have added a SMA of the ADX. The crossings of both are shown with a background color:
The indicator is optimated for small browser windows or multiple chart layouts where you have not much space left for your indicators but you also want to read the indicator signals.
For access please leave a comment.
Please provide feedback.
- Background gray => ADX under configured lower level which means no trend is present
- Background dark orange => ADX between lower and upper level and down trend is present
- Background orange => ADX between over upper level and down trend is overheated
- Background dark green => ADX between lower and upper level and up trend is present
- Background lime => ADX between over upper level and up trend is overheated
Additionally i have added a SMA of the ADX. The crossings of both are shown with a background color:
- yellow => ADX crossed SMA line upward which is the case with rising trend
- fuchsia => ADX crossed SMA line downward which is the case with falling trend
The indicator is optimated for small browser windows or multiple chart layouts where you have not much space left for your indicators but you also want to read the indicator signals.
For access please leave a comment.
Please provide feedback.
招待専用スクリプト
このスクリプトは作者が承認したユーザーのみアクセス可能です。使用するにはアクセス申請をして許可を得る必要があります。通常は支払い後に承認されます。詳細は下記の作者の指示に従うか、TominatorGERに直接お問い合わせください。
TradingViewは、作者を完全に信頼し、スクリプトの動作を理解していない限り、有料スクリプトの購入・使用を推奨しません。コミュニティスクリプトには無料のオープンソースの代替が多数あります。
作者の指示
免責事項
この情報および投稿は、TradingViewが提供または推奨する金融、投資、トレード、その他のアドバイスや推奨を意図するものではなく、それらを構成するものでもありません。詳細は利用規約をご覧ください。