INVITE-ONLY SCRIPT
DASM MACD
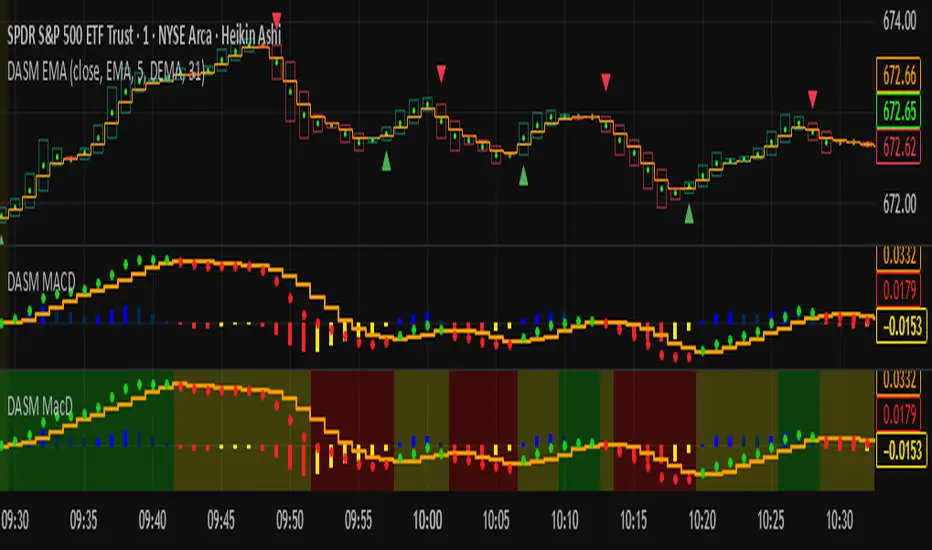
MACD rules:
- The main trend is bullish when the MACD is above the zero line, and bearish when it’s below.
- The histogram shows when a trend starts and when it’s losing strength.
- The background color highlights the trend direction.
- The EMA is easy to read — green means buy, red means sell.
招待専用スクリプト
このスクリプトは作者が承認したユーザーのみアクセス可能です。使用するにはアクセス申請をして許可を得る必要があります。通常は支払い後に承認されます。詳細は下記の作者の指示に従うか、DASMCODEに直接お問い合わせください。
TradingViewは、作者を完全に信頼し、スクリプトの動作を理解していない限り、有料スクリプトの購入・使用を推奨しません。コミュニティスクリプトには無料のオープンソースの代替が多数あります。
作者の指示
MACD rules:
The main trend is bullish when the MACD is above the zero line, and bearish when it’s below.
The histogram shows when a trend starts and when it’s losing strength.
The background color highlights the trend direction.
The EMA is easy to read
免責事項
この情報および投稿は、TradingViewが提供または推奨する金融、投資、トレード、その他のアドバイスや推奨を意図するものではなく、それらを構成するものでもありません。詳細は利用規約をご覧ください。