INVITE-ONLY SCRIPT
Smart Money Flow Pro (Dual Mode: MCD & MCDX) MI02b
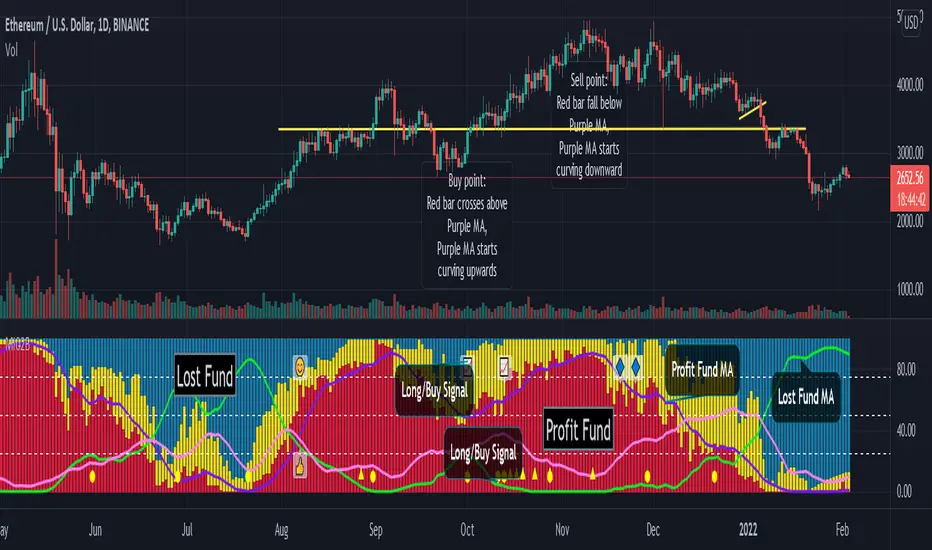
Smart Money Flow Pro (MI02b) indicator shows Buyer / Seller activities by calculating series of Price & Volume data, over a certain period of time.
It analyses Institutional fund possible behavior from the pool of data derived from price volume movement every trading day.
RED bar represents percentage of stock holders are currently in profit.
Purple line is RED bar's moving average.
Green bar represents percentage of stock holders are currently in loss.
Lime Green line is Green bar's moving average.
Yellow bar represents percentage of daily traders (buy & sell at the same day).
Pink line is Yellow bar's moving average.
RED bar > 50% shows institution fund has in control, uptrend is likely easier to continue.
BLUE bar > 50% shows retailer fund is stucked inside, downtrend is likely easier to continue.
Crossing of moving average lines indicates changing of trend (reversal sign):
1) Purple line up-crossed Green line - UPTREND
2) Green line up-crossed Purple line - DOWNTREND
Smart Money Flow Pro includes 6 Long/Buy signals (🔺, ⭕️, 👍, 😊, 📈, 🔷)
Each signals comes with individual alert setting.
Disclaimer:
This script indicator is solely for the purpose of education / opinion sharing only, and should not be construed as investment advice or recommendations to buy or sell any security.
Get your trade advise from a legit broker, you are responsible on your own trade.
Thank you.
招待専用スクリプト
このスクリプトは作者が承認したユーザーのみアクセス可能です。使用するにはアクセス申請をして許可を得る必要があります。通常は支払い後に承認されます。詳細は下記の作者の指示に従うか、magicswingsに直接お問い合わせください。
TradingViewは、作者を完全に信頼し、スクリプトの動作を理解していない限り、有料スクリプトの購入・使用を推奨しません。コミュニティスクリプトには無料のオープンソースの代替が多数あります。
作者の指示
Please send message or comment to request for free trial & subscription details. Thank you. :)
免責事項
この情報および投稿は、TradingViewが提供または推奨する金融、投資、トレード、その他のアドバイスや推奨を意図するものではなく、それらを構成するものでもありません。詳細は利用規約をご覧ください。