PROTECTED SOURCE SCRIPT
Bottom Indicator
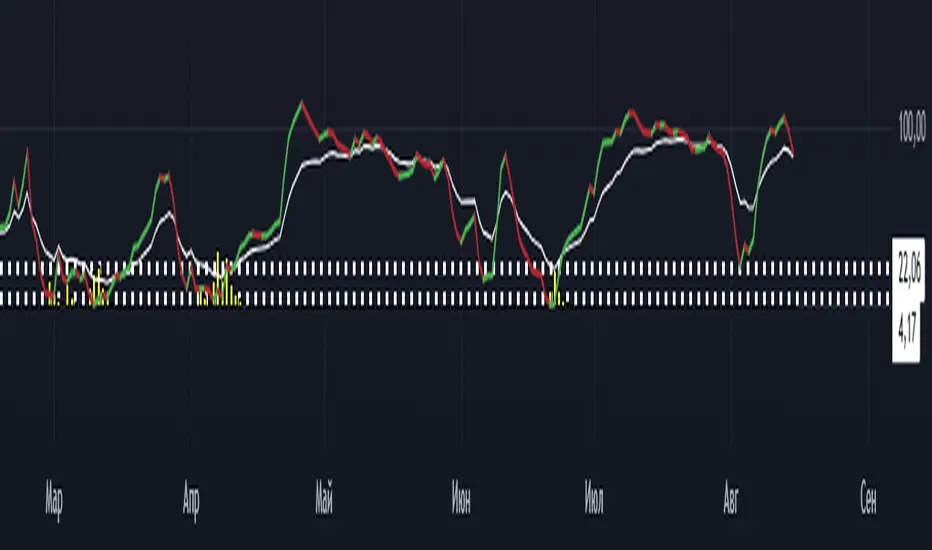
Indicator" identifies when the price is hitting local lows and large players might be stepping in (signaled by a yellow histogram). It overlays a KDJ oscillator and considers it a strong long signal if the purple (J) line is below 4, the white (K) line is below 22, and the yellow histogram is present. In other words, it spots a deeply oversold condition with big player activity as a prime buying opportunity.
保護スクリプト
このスクリプトのソースコードは非公開で投稿されています。 ただし、制限なく自由に使用できます – 詳細はこちらでご確認ください。
免責事項
この情報および投稿は、TradingViewが提供または推奨する金融、投資、トレード、その他のアドバイスや推奨を意図するものではなく、それらを構成するものでもありません。詳細は利用規約をご覧ください。
保護スクリプト
このスクリプトのソースコードは非公開で投稿されています。 ただし、制限なく自由に使用できます – 詳細はこちらでご確認ください。
免責事項
この情報および投稿は、TradingViewが提供または推奨する金融、投資、トレード、その他のアドバイスや推奨を意図するものではなく、それらを構成するものでもありません。詳細は利用規約をご覧ください。