PROTECTED SOURCE SCRIPT
Bell Curve Levels
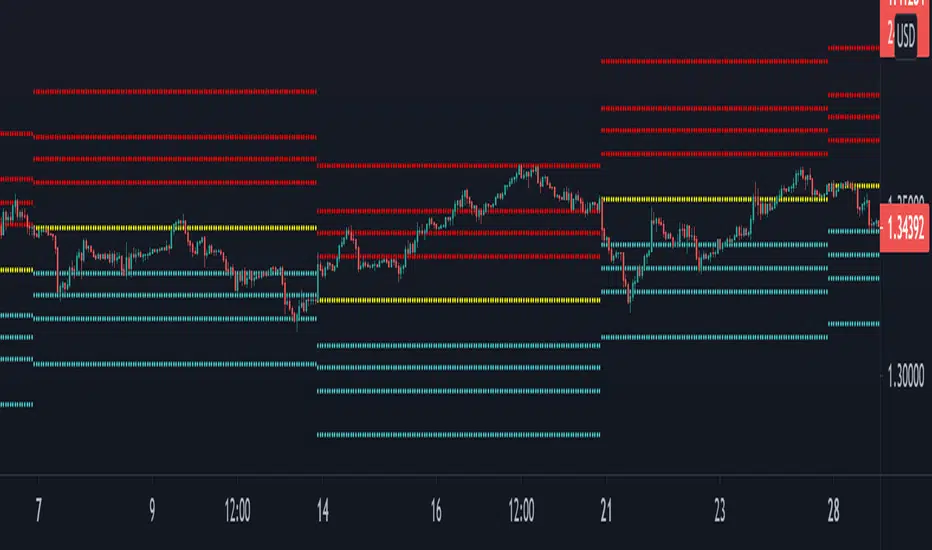
Script which plots the % change from the open and overlays the 1, 1.5, 2 & 3% levels on the chart.
The bell curve offers a quantifiable clue to the persistent percentages the price moves in the fx market. A simple histogram will convey the %change in bins
this indicator just reflects that with levels on the chart.
Can be an aide for intraday or longer term levels.
Feel free to message me with any queries.
保護スクリプト
このスクリプトのソースコードは非公開で投稿されています。 ただし、制限なく自由に使用できます – 詳細はこちらでご確認ください。
免責事項
この情報および投稿は、TradingViewが提供または推奨する金融、投資、トレード、その他のアドバイスや推奨を意図するものではなく、それらを構成するものでもありません。詳細は利用規約をご覧ください。
保護スクリプト
このスクリプトのソースコードは非公開で投稿されています。 ただし、制限なく自由に使用できます – 詳細はこちらでご確認ください。
免責事項
この情報および投稿は、TradingViewが提供または推奨する金融、投資、トレード、その他のアドバイスや推奨を意図するものではなく、それらを構成するものでもありません。詳細は利用規約をご覧ください。