PROTECTED SOURCE SCRIPT
Gann Seasonal Dates - CE
Gann Seasonal Dates - Community Edition
Welcome to the Gann Seasonal Dates V1.61 - Community Edition, a powerful tool designed to enhance time-based trading with W.D. Gann’s seasonal date methodology. This feature-complete indicator allows traders to plot critical seasonal dates on charts for equities, forex, commodities, and cryptocurrencies. It empowers traders to anticipate market turning points with precision.
Overview
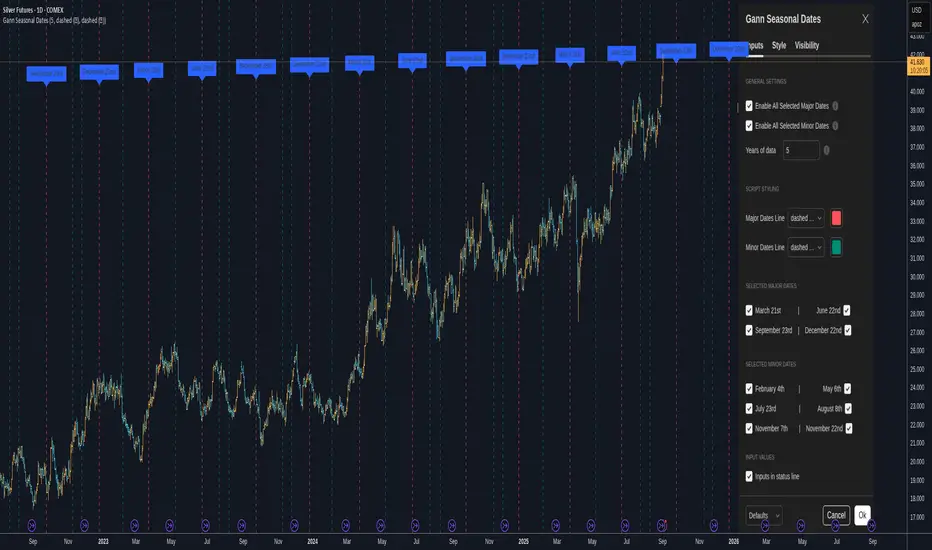
The Gann Seasonal Dates plots Gann’s major and minor seasonal dates, which are rooted in the cyclical nature of solstices, equinoxes, and their midpoints. Major dates include the vernal equinox (March 21st), summer solstice (June 22nd), autumnal equinox (September 23rd), and winter solstice (December 22nd). Minor dates mark the halfway points between these events (February 4th, May 6th, July 23rd, August 8th, November 7th, and November 22nd). With customizable styling and historical data up to 50 years, this script helps traders identify key time-based market events.
Key Features
How It Works
Get Started
As a gift to the TradingView community and Gann traders, the Gann Seasonal Dates - Community Edition is provided free of charge. With no features locked, this tool offers full access to Gann’s seasonal date methodology for precise time-based analysis. Trade wisely and leverage the power of seasonal cycles!
Welcome to the Gann Seasonal Dates V1.61 - Community Edition, a powerful tool designed to enhance time-based trading with W.D. Gann’s seasonal date methodology. This feature-complete indicator allows traders to plot critical seasonal dates on charts for equities, forex, commodities, and cryptocurrencies. It empowers traders to anticipate market turning points with precision.
Overview
The Gann Seasonal Dates plots Gann’s major and minor seasonal dates, which are rooted in the cyclical nature of solstices, equinoxes, and their midpoints. Major dates include the vernal equinox (March 21st), summer solstice (June 22nd), autumnal equinox (September 23rd), and winter solstice (December 22nd). Minor dates mark the halfway points between these events (February 4th, May 6th, July 23rd, August 8th, November 7th, and November 22nd). With customizable styling and historical data up to 50 years, this script helps traders identify key time-based market events.
Key Features
- Major and Minor Seasonal Dates: Plot four major dates (solstices and equinoxes) and six minor dates (midpoints) to highlight potential market turning points.
- Customizable Date Selection: Enable or disable individual major and minor dates to focus on specific cycles relevant to your analysis.
- Historical Data Range: Adjust the lookback period up to 50 years, with recommendations for optimal performance based on your TradingView plan (5 years for Basic, 20 for Pro/Pro+/Premium).
- Styling Options: Customize line styles (solid, dotted, dashed) and colors for major and minor dates to enhance chart clarity.
- Labeled Visuals: Each plotted date includes a label with a tooltip (e.g., "Vernal equinox") for easy identification and context.
How It Works
- Configure Settings: Enable major and/or minor dates and select specific dates (e.g., March 21st, February 4th) to display on your chart.
- Set Historical Range: Adjust the years of data (up to 50) to plot historical seasonal dates, ensuring compatibility with your TradingView plan’s processing limits.
- Customize Styling: Choose line styles and colors for major and minor dates to differentiate them visually.
- Analyze and Trade: Use the plotted vertical lines and labels to identify potential market turning points, integrating Gann’s time-based cycles into your strategy.
Get Started
As a gift to the TradingView community and Gann traders, the Gann Seasonal Dates - Community Edition is provided free of charge. With no features locked, this tool offers full access to Gann’s seasonal date methodology for precise time-based analysis. Trade wisely and leverage the power of seasonal cycles!
保護スクリプト
このスクリプトのソースコードは非公開で投稿されています。 ただし、制限なく自由に使用できます – 詳細はこちらでご確認ください。
免責事項
この情報および投稿は、TradingViewが提供または推奨する金融、投資、トレード、その他のアドバイスや推奨を意図するものではなく、それらを構成するものでもありません。詳細は利用規約をご覧ください。
保護スクリプト
このスクリプトのソースコードは非公開で投稿されています。 ただし、制限なく自由に使用できます – 詳細はこちらでご確認ください。
免責事項
この情報および投稿は、TradingViewが提供または推奨する金融、投資、トレード、その他のアドバイスや推奨を意図するものではなく、それらを構成するものでもありません。詳細は利用規約をご覧ください。