PROTECTED SOURCE SCRIPT
Colour Change MACD
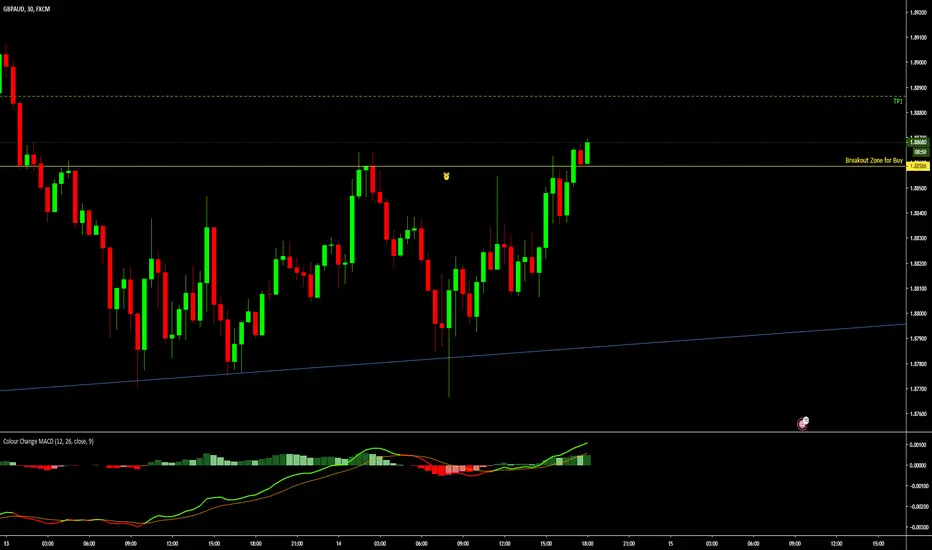
Tradition MACD but the MACD Line changes colour when it crosses the Signal line
Green indicates a buyers market
Red indicates a seller's market
The ideal time to BUY is when the MACD line is GREEN heading upwards and above or crossing the Histogram
The Ideal time to sell is when the MACD line is RED heading down and Below or crossing from top to bottom of the Histogram
Green indicates a buyers market
Red indicates a seller's market
The ideal time to BUY is when the MACD line is GREEN heading upwards and above or crossing the Histogram
The Ideal time to sell is when the MACD line is RED heading down and Below or crossing from top to bottom of the Histogram
保護スクリプト
このスクリプトのソースコードは非公開で投稿されています。 ただし、制限なく自由に使用できます – 詳細はこちらでご確認ください。
免責事項
この情報および投稿は、TradingViewが提供または推奨する金融、投資、トレード、その他のアドバイスや推奨を意図するものではなく、それらを構成するものでもありません。詳細は利用規約をご覧ください。
免責事項
この情報および投稿は、TradingViewが提供または推奨する金融、投資、トレード、その他のアドバイスや推奨を意図するものではなく、それらを構成するものでもありません。詳細は利用規約をご覧ください。