INVITE-ONLY SCRIPT
KPV by Killpips
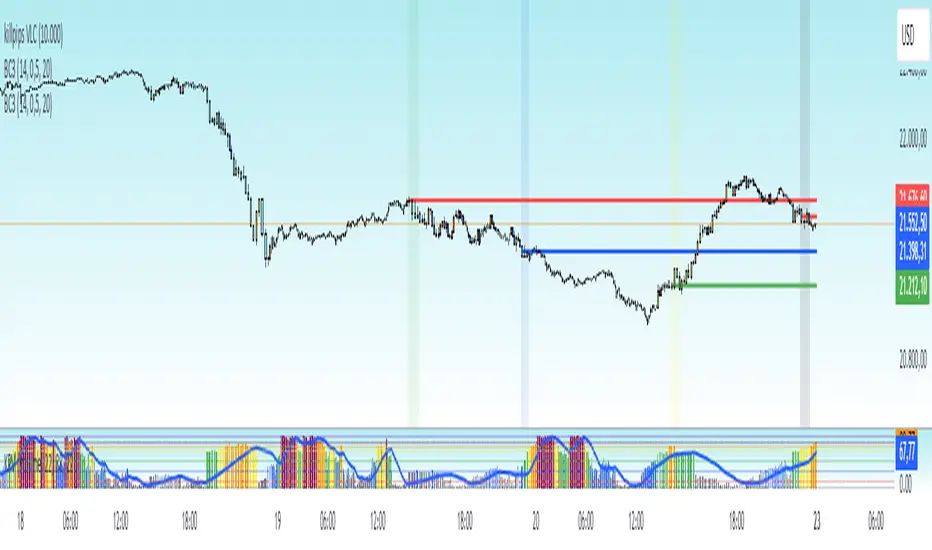
This Pine Script code is an indicator for the TradingView platform that calculates and plots volume percentiles over different time frames (daily, weekly, and monthly). It includes a volume percentile histogram.
Main Code Logic:
Historical Volatility (hvv):
The fHV function is called to calculate the volatility for the logarithmic volume values.
Volume Percentile (hvvp):
The fHVP function calculates the volume percentile based on the calculated historical volatility (hvv).
Percentile Ranks:
prv: The percentile rank of the volume percentile (hvvp) over the last avg periods (to represent the average volume percentile).
prv_1week: The percentile rank of the volume percentile over the last 5 times the avg period (to represent the weekly volume percentile, assuming 5 trading days in a week).
prv_1month: The percentile rank of the volume percentile over the last 22 times the avg period (to represent the monthly volume percentile, assuming 22 trading days in a month).
Volume Percentile Histogram (VV):
The VV variable represents the current value of the volume percentile (hvvp), which is plotted as a histogram. The color of the bars changes depending on the value of VV:
Maroon if above 90
Orange if between 80 and 90
Yellow if between 71 and 79
Green if between 50 and 70
Blu if between 49 and 31
Gray if below 30
招待専用スクリプト
このスクリプトは作者が承認したユーザーのみアクセス可能です。使用するにはアクセス申請をして許可を得る必要があります。通常は支払い後に承認されます。詳細は下記の作者の指示に従うか、killpipsに直接お問い合わせください。
このプライベートの招待専用スクリプトはモデレーターによる審査を受けておらず、ハウスルールへの準拠状況は未確認です。 TradingViewは、作者を完全に信頼し、スクリプトの動作を理解していない限り、有料スクリプトの購入・使用を推奨しません。コミュニティスクリプトには無料のオープンソースの代替が多数あります。
作者の指示
Main Code Logic:
Historical Volatility (hvv):
The fHV function is called to calculate the volatility for the logarithmic volume values.
Volume Percentile (hvvp):
The fHVP function calculates the volume percentile based on the calculated historical vola
“A winner is just a man who never gave up.”
免責事項
この情報および投稿は、TradingViewが提供または推奨する金融、投資、トレード、その他のアドバイスや推奨を意図するものではなく、それらを構成するものでもありません。詳細は利用規約をご覧ください。