PROTECTED SOURCE SCRIPT
Equities Open
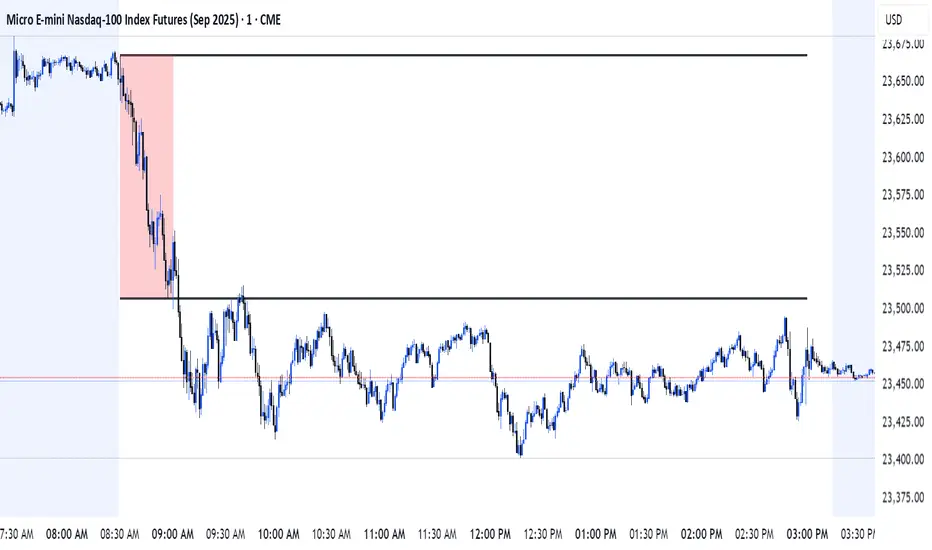
The Equities Open indicator makes it easy to spot the highest and lowest prices during the equities open or a customizable time you choose. It draws lines to show the high and low points and extends them across the chart to a time you pick, such as 3:00 PM that same day. A shaded box highlights the price range during that session. You can customize things such as the session time, timezone, line thickness, colors, and choose if you want the shaded box to show up. It’s built to run smoothly and works best for charts with short timeframes (up to 59 minutes). Perfect for traders who want to focus on key price levels set during pre-market hours!
保護スクリプト
このスクリプトのソースコードは非公開で投稿されています。 しかし、無料かつ制限なしでご利用いただけます ― 詳細についてはこちらをご覧ください。
免責事項
これらの情報および投稿は、TradingViewが提供または保証する金融、投資、取引、またはその他の種類のアドバイスや推奨を意図したものではなく、またそのようなものでもありません。詳しくは利用規約をご覧ください。
保護スクリプト
このスクリプトのソースコードは非公開で投稿されています。 しかし、無料かつ制限なしでご利用いただけます ― 詳細についてはこちらをご覧ください。
免責事項
これらの情報および投稿は、TradingViewが提供または保証する金融、投資、取引、またはその他の種類のアドバイスや推奨を意図したものではなく、またそのようなものでもありません。詳しくは利用規約をご覧ください。