INVITE-ONLY SCRIPT
𝙵𝚛𝚊𝚖𝚎𝚠𝚘𝚛𝚔|[𝙰|𝛺]
This indicator was designed and coded by me, providing a clean and efficient adaptation of the teachings from Inner Circle Trading (ICT). The tool is intended to display various data points that help streamline and simplify your trading process. However, it does not generate signals or recommendations for trade execution.
It is designed to automatically display different components according to the timeframe you are analyzing. From the Hourly chart down to the seconds, you will be able to visualize a wide range of time-based data points in one indicator.
On the Hourly timeframe, the indicator begins with the Weekly Profile using the True Day [00:00 to 00:00]. You will be able to visualize Monday’s price extended throughout the entire week, as well as each individual day of the week separately.

You can also visualize the equilibrium and quadrants of each individual day, if desired.

ICT 3-Day Protocol: This feature extends the highs and lows of the previous two days up to the current candle. These levels can serve as potential draws on liquidity or reference points for identifying opportunities on lower timeframes.

M15 Timeframe
On this timeframe, you will be able to visualize the previously mentioned elements, with the addition of the Asian and London sessions. These are included to help outline the potential intraday profile, as well as the highs and lows of these sessions, since they represent relevant data points.
You will also have the option to display projections of these ranges. These projections are useful for anticipating potential price manipulation and distribution levels, using Midnight Open as the reference point for the Daily PO3.
You will also be able to visualize different Opens, including:
• 00:00
• 08:30
• 09:30
• 13:30
• Previous day’s Settlement Price
These levels represent relevant data points that can be used to frame implied discount or premium conditions relative to the Time of Day.

M1 and Seconds
On this timeframe, you will be able to see the previously mentioned elements, along with additional features.
Market Session Dividers: These are included to provide a clear and organized visual reference of which session the market is currently in, as well as the separation between one session and another.**

Opening Ranges: This feature allows you to visualize the Opening Range of the AM and PM sessions, along with their respective projections. You can also choose whether to extend these ranges over time or keep them limited to their formation period.

First Presentations: This feature allows you to visualize the initial imbalance of the Regular Trading Hours session, including both the AM and PM sessions.
Additionally, an option is included in the menu to indicate if the current day has high-impact news before the 09:30 open, allowing you to consider including the formation of the First Presented Gap from 09:29, as recommended by ICT.
You can also enable alerts to be notified each time a First Presentation is formed.

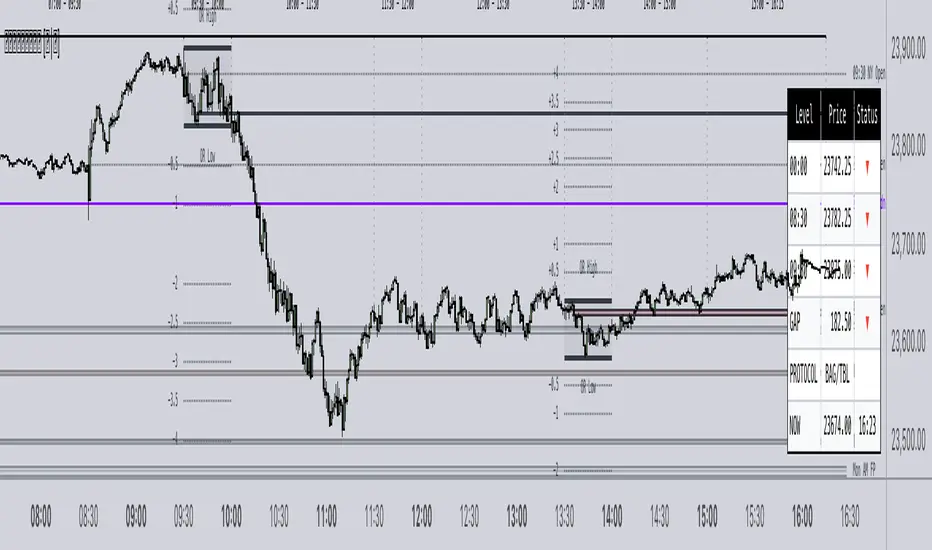
Table: This feature displays a table with the various Openings mentioned earlier. It shows the price and indicates whether the market is at a Discount or Premium relative to these levels using an arrow.
The table also displays the size of the Opening Range Gap and, with an arrow, indicates whether it is a Premium or Discount Gap.
It provides different possible protocols based on the gap size and other elements taught by ICT to help anticipate certain market scenarios.
Additionally, it shows the current time and changes the color of the time indicator depending on whether you are within a macro session or not. This keeps your chart clean while still allowing you to know if the market is in a macro session.

All elements of the indicator are customizable. You can personalize virtually every component to suit your preferences.

The Engineer.
It is designed to automatically display different components according to the timeframe you are analyzing. From the Hourly chart down to the seconds, you will be able to visualize a wide range of time-based data points in one indicator.
On the Hourly timeframe, the indicator begins with the Weekly Profile using the True Day [00:00 to 00:00]. You will be able to visualize Monday’s price extended throughout the entire week, as well as each individual day of the week separately.
You can also visualize the equilibrium and quadrants of each individual day, if desired.
ICT 3-Day Protocol: This feature extends the highs and lows of the previous two days up to the current candle. These levels can serve as potential draws on liquidity or reference points for identifying opportunities on lower timeframes.
M15 Timeframe
On this timeframe, you will be able to visualize the previously mentioned elements, with the addition of the Asian and London sessions. These are included to help outline the potential intraday profile, as well as the highs and lows of these sessions, since they represent relevant data points.
You will also have the option to display projections of these ranges. These projections are useful for anticipating potential price manipulation and distribution levels, using Midnight Open as the reference point for the Daily PO3.
You will also be able to visualize different Opens, including:
• 00:00
• 08:30
• 09:30
• 13:30
• Previous day’s Settlement Price
These levels represent relevant data points that can be used to frame implied discount or premium conditions relative to the Time of Day.
M1 and Seconds
On this timeframe, you will be able to see the previously mentioned elements, along with additional features.
Market Session Dividers: These are included to provide a clear and organized visual reference of which session the market is currently in, as well as the separation between one session and another.**
Opening Ranges: This feature allows you to visualize the Opening Range of the AM and PM sessions, along with their respective projections. You can also choose whether to extend these ranges over time or keep them limited to their formation period.
First Presentations: This feature allows you to visualize the initial imbalance of the Regular Trading Hours session, including both the AM and PM sessions.
Additionally, an option is included in the menu to indicate if the current day has high-impact news before the 09:30 open, allowing you to consider including the formation of the First Presented Gap from 09:29, as recommended by ICT.
You can also enable alerts to be notified each time a First Presentation is formed.
Table: This feature displays a table with the various Openings mentioned earlier. It shows the price and indicates whether the market is at a Discount or Premium relative to these levels using an arrow.
The table also displays the size of the Opening Range Gap and, with an arrow, indicates whether it is a Premium or Discount Gap.
It provides different possible protocols based on the gap size and other elements taught by ICT to help anticipate certain market scenarios.
Additionally, it shows the current time and changes the color of the time indicator depending on whether you are within a macro session or not. This keeps your chart clean while still allowing you to know if the market is in a macro session.
All elements of the indicator are customizable. You can personalize virtually every component to suit your preferences.
The Engineer.
招待専用スクリプト
このスクリプトは作者が承認したユーザーのみアクセス可能です。使用するにはアクセス申請をして許可を得る必要があります。通常は支払い後に承認されます。詳細は下記の作者の指示に従うか、The_IAO_に直接お問い合わせください。
TradingViewは、作者を完全に信頼し、スクリプトの動作を理解していない限り、有料スクリプトの購入・使用を推奨しません。コミュニティスクリプトには無料のオープンソースの代替が多数あります。
作者の指示
X: @Engineer_RTH
免責事項
この情報および投稿は、TradingViewが提供または推奨する金融、投資、トレード、その他のアドバイスや推奨を意図するものではなく、それらを構成するものでもありません。詳細は利用規約をご覧ください。