INVITE-ONLY SCRIPT
更新済 RSI, CCI WaveTrend God by Keiron Richie
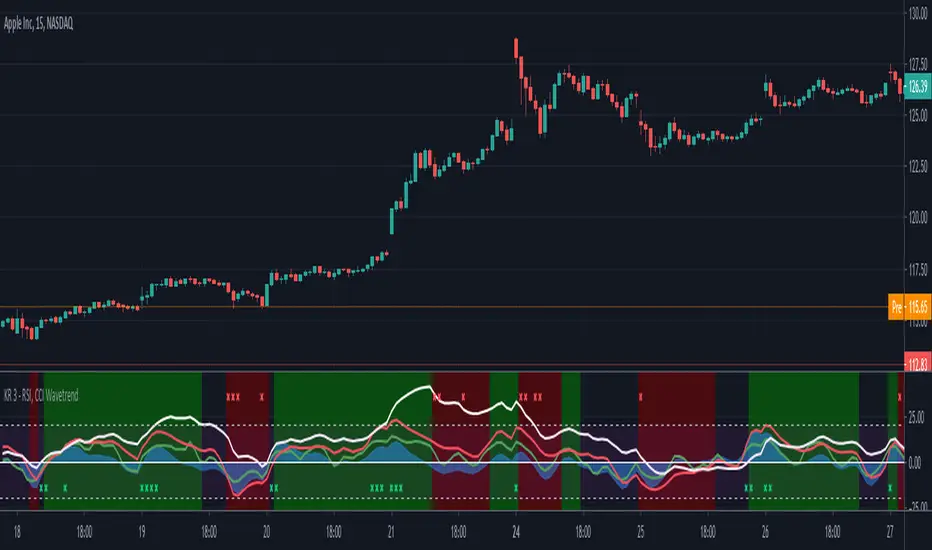
This script uses Relative Strength Index ( RSI ), Commodity Channel Index ( CCI ) and WaveTrend (WT) together as an oscillator with an additional custom RSI rate of change indicator and buy/sell background color zones derived from a complex combination of these indicators.
The White line shows the moving average of RSI as an oscillator
The Green line is the fast Exponential Moving Average ( EMA ) of CCI & the Red line is the slow EMA of CCI .
The Blue area is the EMA of WaveTrend WT
How to read:
If the RSI , CCI or WT crosses above a programmed threshold and the other lines are also within a pre-defined buy range then the background will change to green for buy.
If the RSI , CCI or WT crosses below a programmed threshold and the other lines are also within a pre-defined sell range then the background will change to red for sell.
Where requirements are not met, the background is neither green nor red.
There are also red and green indicator x’s at the top/bottom of the indicator. They show a drastic change in Relative strength within a short period. This often indicates an immediate buy or sell opportunity.
Buy, Sell, Exit Buy and Exit Sell alerts are included.
Use the link below to obtain access to this indicator.
リリースノート
Adapted the sell signal criteria to allow for sell entry when all lines remained beneath the zero line.招待専用スクリプト
このスクリプトは作者が承認したユーザーのみアクセス可能です。使用するにはアクセス申請をして許可を得る必要があります。通常は支払い後に承認されます。詳細は下記の作者の指示に従うか、VentureWealthに直接お問い合わせください。
TradingViewは、作者を完全に信頼し、スクリプトの動作を理解していない限り、有料スクリプトの購入・使用を推奨しません。コミュニティスクリプトには無料のオープンソースの代替が多数あります。
作者の指示
免責事項
この情報および投稿は、TradingViewが提供または推奨する金融、投資、トレード、その他のアドバイスや推奨を意図するものではなく、それらを構成するものでもありません。詳細は利用規約をご覧ください。
招待専用スクリプト
このスクリプトは作者が承認したユーザーのみアクセス可能です。使用するにはアクセス申請をして許可を得る必要があります。通常は支払い後に承認されます。詳細は下記の作者の指示に従うか、VentureWealthに直接お問い合わせください。
TradingViewは、作者を完全に信頼し、スクリプトの動作を理解していない限り、有料スクリプトの購入・使用を推奨しません。コミュニティスクリプトには無料のオープンソースの代替が多数あります。
作者の指示
免責事項
この情報および投稿は、TradingViewが提供または推奨する金融、投資、トレード、その他のアドバイスや推奨を意図するものではなく、それらを構成するものでもありません。詳細は利用規約をご覧ください。