INVITE-ONLY SCRIPT
DBT MoMo Divergence Finder
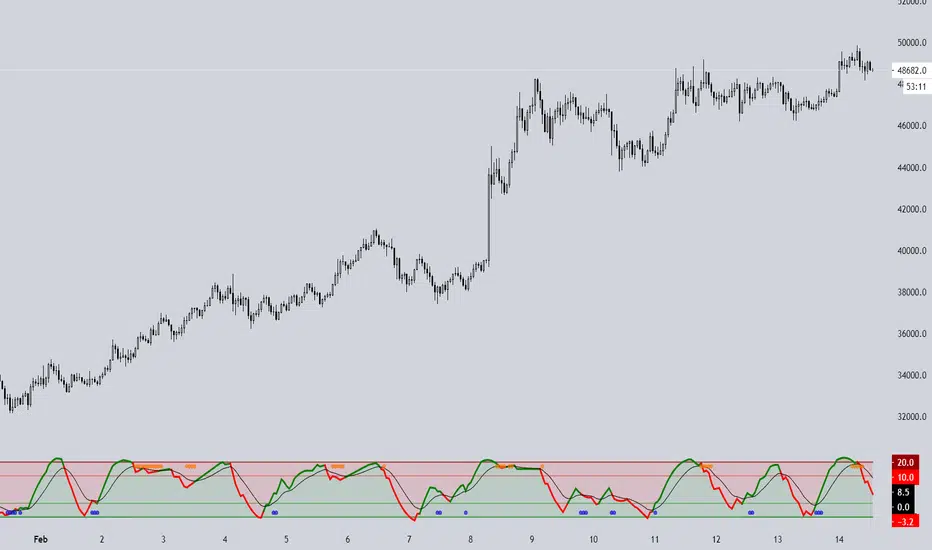
This Indicator is an experimental Divergence Finder using the DBT MoMo formula. See DBT MoMo v.4 for details on the main script.
https://www.tradingview.com/script/t57XmNGo-DBT-MoMo-v-4/
It uses a slower version of the DBT MoMo Price Line to smooth out the trend and color codes the Price Line based on its trend.
Bullish Divergence is denoted by Blue Labels below the Price Line.
Bearish Divergence is denoted by Orange Labels above the Price Line.
Alerts can be setup in Tradingview for both Bullish and Bearish Divergence Signals.
This indicator is brand new and experimental, make sure to double check the Divergence Alerts before blindly trading them. There can be a mathematical divergence without there being a visual divergence, this will trigger a false alert.
Everyone with access to the DBT MoMo will have access to this indicator as well.
招待専用スクリプト
このスクリプトは作者が承認したユーザーのみアクセス可能です。使用するにはアクセス申請をして許可を得る必要があります。通常は支払い後に承認されます。詳細は下記の作者の指示に従うか、OasisTradingに直接お問い合わせください。
TradingViewは、作者を完全に信頼し、スクリプトの動作を理解していない限り、有料スクリプトの購入・使用を推奨しません。コミュニティスクリプトには無料のオープンソースの代替が多数あります。
作者の指示
Website
oasistrading.io
Meet the Team.
twitter.com/DejaBrewTrades
tradingview.com/u/gyromatical/
oasistrading.io
Meet the Team.
twitter.com/DejaBrewTrades
tradingview.com/u/gyromatical/
免責事項
この情報および投稿は、TradingViewが提供または推奨する金融、投資、トレード、その他のアドバイスや推奨を意図するものではなく、それらを構成するものでもありません。詳細は利用規約をご覧ください。