INVITE-ONLY SCRIPT
PbF
What kind of traders/investors are we?
We are trend followers, always on the lookout for the next big move in the market. Our scripts are meticulously crafted for higher timeframes (daily, weekly, monthly) aiming to capture the large market trends.
What does the PbF script do?
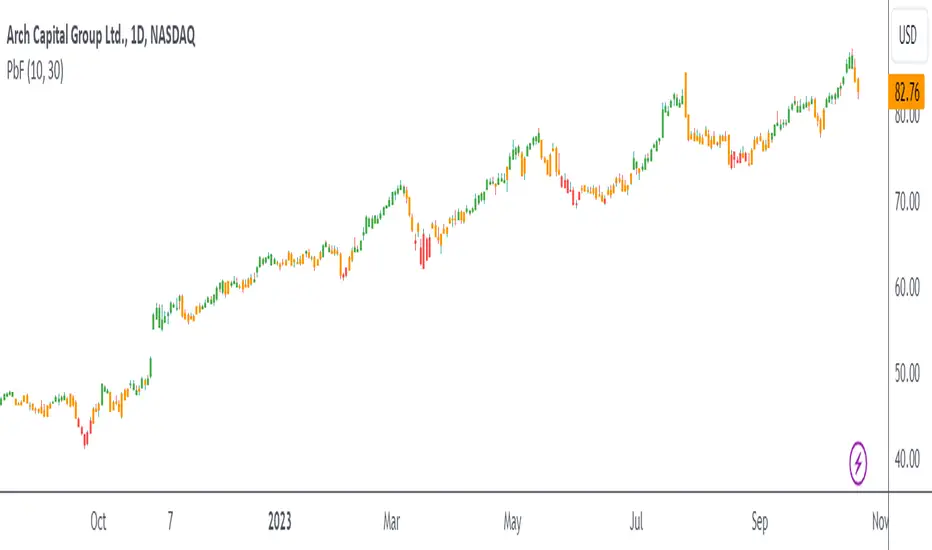
The PbF script simplifies the complex world of investing by colour-coding bars to indicate the trend direction. Green bars signify a bullish trend, red indicates a bearish trend, and orange is a precursor to potential pullback opportunities. This visual representation ensures investors can quickly gauge the market's direction and act accordingly.
How is the PbF produced?
The PbF script employs simple moving averages (SMA) as its backbone. Bars positioned above both the SMAs turn green, indicating a bullish trend. Conversely, bars below these SMAs turn red, signalling a bearish trend. When a bar oscillates between the SMAs, it turns orange, hinting at a potential pullback scenario.
What is the best timeframe to use the script?
The PbF script is designed for the weekly timeframe. By focusing on this timeframe, traders can pinpoint pullback positions, ensuring they are in sync with long-term market trends.
What makes the PbF script unique?
The challenges of identifying the onset, progression, and culmination of trends are well-known in the investing community. The PbF script addresses these challenges head-on.
First and foremost:
Designed explicitly for the weekly timeframe, the PbF also offers investors:
In essence, the PbF script is a trend filter that ensures investors remain aligned with long-term market trends, capitalising on pullbacks as the trend develops.
We are trend followers, always on the lookout for the next big move in the market. Our scripts are meticulously crafted for higher timeframes (daily, weekly, monthly) aiming to capture the large market trends.
What does the PbF script do?
The PbF script simplifies the complex world of investing by colour-coding bars to indicate the trend direction. Green bars signify a bullish trend, red indicates a bearish trend, and orange is a precursor to potential pullback opportunities. This visual representation ensures investors can quickly gauge the market's direction and act accordingly.
How is the PbF produced?
The PbF script employs simple moving averages (SMA) as its backbone. Bars positioned above both the SMAs turn green, indicating a bullish trend. Conversely, bars below these SMAs turn red, signalling a bearish trend. When a bar oscillates between the SMAs, it turns orange, hinting at a potential pullback scenario.
What is the best timeframe to use the script?
The PbF script is designed for the weekly timeframe. By focusing on this timeframe, traders can pinpoint pullback positions, ensuring they are in sync with long-term market trends.
What makes the PbF script unique?
The challenges of identifying the onset, progression, and culmination of trends are well-known in the investing community. The PbF script addresses these challenges head-on.
First and foremost:
- The PbF remains orange during extended periods of pullbacks and will only change colour when the pullback has ended.
- The filter also highlights an earlier entry from the previous bar if the market continues to pull back against the long-term trend, allowing you to adjust your entry as required.
Designed explicitly for the weekly timeframe, the PbF also offers investors:
- A clear roadmap to discern the beginning, middle, and end of market trends.
- The flexibility to exercise discretion when entering pullback positions.
In essence, the PbF script is a trend filter that ensures investors remain aligned with long-term market trends, capitalising on pullbacks as the trend develops.
招待専用スクリプト
このスクリプトは作者が承認したユーザーのみアクセス可能です。使用するにはアクセス申請をして許可を得る必要があります。通常は支払い後に承認されます。詳細は下記の作者の指示に従うか、Sublime_Tradingに直接お問い合わせください。
TradingViewは、作者を完全に信頼し、スクリプトの動作を理解していない限り、有料スクリプトの購入・使用を推奨しません。コミュニティスクリプトには無料のオープンソースの代替が多数あります。
作者の指示
This is a tool for Sublime Trading community members only. If you DM us your email, we will send you details on joining the community.
Join Our Private Community
bit.ly/join-ST-community
Plus Get Our Ultimate Stock Market Blueprint.
bit.ly/join-ST-community
Plus Get Our Ultimate Stock Market Blueprint.
免責事項
この情報および投稿は、TradingViewが提供または推奨する金融、投資、トレード、その他のアドバイスや推奨を意図するものではなく、それらを構成するものでもありません。詳細は利用規約をご覧ください。