INVITE-ONLY SCRIPT
Gold𝑺𝒀𝑵𝑪
🟡 Gold𝑺𝒀𝑵𝑪 - BTC follows GOLD
Gold𝑺𝒀𝑵𝑪 is a quantitative projection tool that visualizes how Bitcoin (BTC/USD) would perform if it mirrored the recent price behavior of Gold (XAU/USD).
It extends Gold’s last n days of normalized performance forward on the BTC chart and builds a volatility-adjusted projection corridor.
⚙️ Core Mechanics
Projection Engine:
Calculates Gold’s relative performance over the selected lookback window and applies it to BTC’s last closing price.
Volatility Scaling:
Computes the rolling standard deviation of Gold’s logarithmic returns to estimate the potential deviation range.
Dynamic Gradient Bands:
Three upper and lower standard deviation layers (1σ, 2σ, 3σ) are drawn using fading gradient fills to visualize increasing uncertainty.
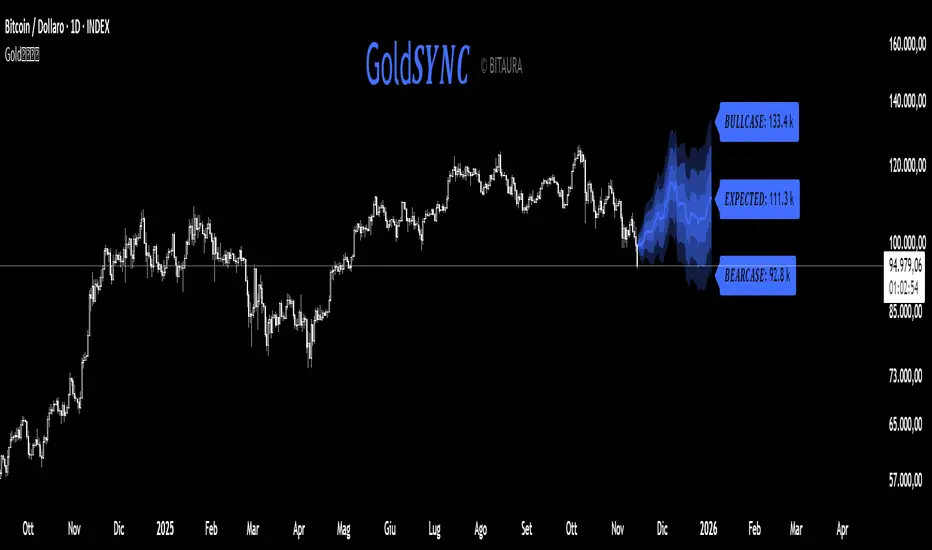
Scenario Labels:
Displays key levels for:
𝑩𝑼𝑳𝑳𝑪𝑨𝑺𝑬 — +2σ projection
𝑬𝑿𝑷𝑬𝑪𝑻𝑬𝑫 — mean projection
𝑩𝑬𝑨𝑹𝑪𝑨𝑺𝑬 — −2σ projection
📈 Usage
Designed for 1D charts (daily timeframe).
Provides a comparative “sync” between Gold and Bitcoin to study cross-asset momentum, volatility symmetry, and directional bias.
Useful in macro correlation analysis or when modeling BTC’s potential movement under Gold-like conditions.
🧠 Interpretation
Gold𝑺𝒀𝑵𝑪 doesn’t predict - it synchronizes.
It offers a contextual view of BTC’s potential path if it followed Gold’s rhythm, enhanced by statistically derived volatility zones.
Created by: SP_Quant
Credits: BitAura
Gold𝑺𝒀𝑵𝑪 is a quantitative projection tool that visualizes how Bitcoin (BTC/USD) would perform if it mirrored the recent price behavior of Gold (XAU/USD).
It extends Gold’s last n days of normalized performance forward on the BTC chart and builds a volatility-adjusted projection corridor.
⚙️ Core Mechanics
Projection Engine:
Calculates Gold’s relative performance over the selected lookback window and applies it to BTC’s last closing price.
Volatility Scaling:
Computes the rolling standard deviation of Gold’s logarithmic returns to estimate the potential deviation range.
Dynamic Gradient Bands:
Three upper and lower standard deviation layers (1σ, 2σ, 3σ) are drawn using fading gradient fills to visualize increasing uncertainty.
Scenario Labels:
Displays key levels for:
𝑩𝑼𝑳𝑳𝑪𝑨𝑺𝑬 — +2σ projection
𝑬𝑿𝑷𝑬𝑪𝑻𝑬𝑫 — mean projection
𝑩𝑬𝑨𝑹𝑪𝑨𝑺𝑬 — −2σ projection
📈 Usage
Designed for 1D charts (daily timeframe).
Provides a comparative “sync” between Gold and Bitcoin to study cross-asset momentum, volatility symmetry, and directional bias.
Useful in macro correlation analysis or when modeling BTC’s potential movement under Gold-like conditions.
🧠 Interpretation
Gold𝑺𝒀𝑵𝑪 doesn’t predict - it synchronizes.
It offers a contextual view of BTC’s potential path if it followed Gold’s rhythm, enhanced by statistically derived volatility zones.
Created by: SP_Quant
Credits: BitAura
招待専用スクリプト
このスクリプトは作者が承認したユーザーのみアクセス可能です。使用するにはアクセス申請をして許可を得る必要があります。通常は支払い後に承認されます。詳細は下記の作者の指示に従うか、BitAuraに直接お問い合わせください。
TradingViewは、作者を完全に信頼し、スクリプトの動作を理解していない限り、有料スクリプトの購入・使用を推奨しません。コミュニティスクリプトには無料のオープンソースの代替が多数あります。
作者の指示
bitaurasystems.com
免責事項
この情報および投稿は、TradingViewが提供または推奨する金融、投資、トレード、その他のアドバイスや推奨を意図するものではなく、それらを構成するものでもありません。詳細は利用規約をご覧ください。