PROTECTED SOURCE SCRIPT
10Y - 2Y Spread (Farbig)
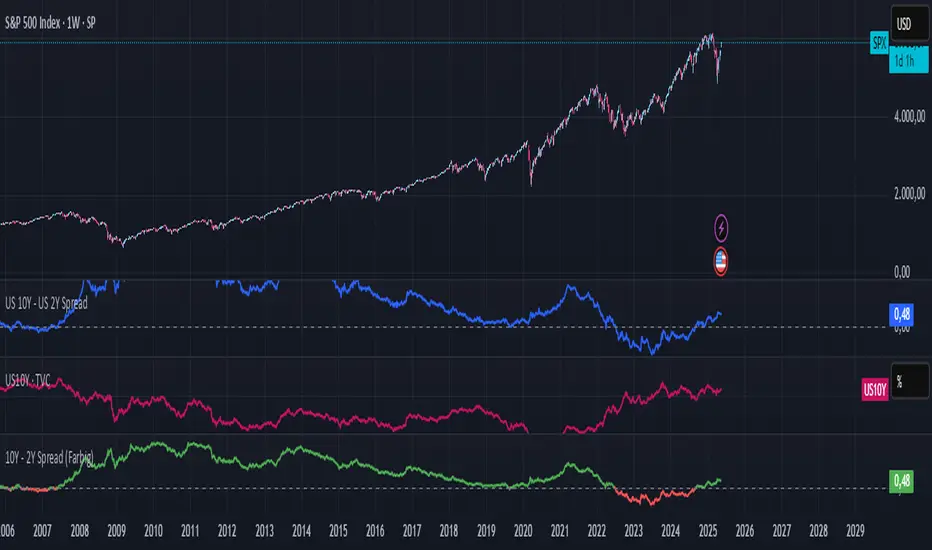
10Y – 2Y Yield Spread (Color-Coded)
Description:
This indicator plots the yield spread between the US 10-Year and 2-Year Treasury yields (US10Y – US02Y) as a color-coded line:
Green = normal yield curve (positive spread)
Red = inverted yield curve (negative spread), often seen as a leading recession signal
A horizontal zero line is added to highlight turning points.
This indicator is ideal for tracking macroeconomic yield curve behavior and can be used alongside equity, crypto, or commodity charts.
保護スクリプト
このスクリプトのソースコードは非公開で投稿されています。 ただし、制限なく自由に使用できます – 詳細はこちらでご確認ください。
免責事項
この情報および投稿は、TradingViewが提供または推奨する金融、投資、トレード、その他のアドバイスや推奨を意図するものではなく、それらを構成するものでもありません。詳細は利用規約をご覧ください。
免責事項
この情報および投稿は、TradingViewが提供または推奨する金融、投資、トレード、その他のアドバイスや推奨を意図するものではなく、それらを構成するものでもありません。詳細は利用規約をご覧ください。