INVITE-ONLY SCRIPT
更新済 Lognormal Bollinger Bands
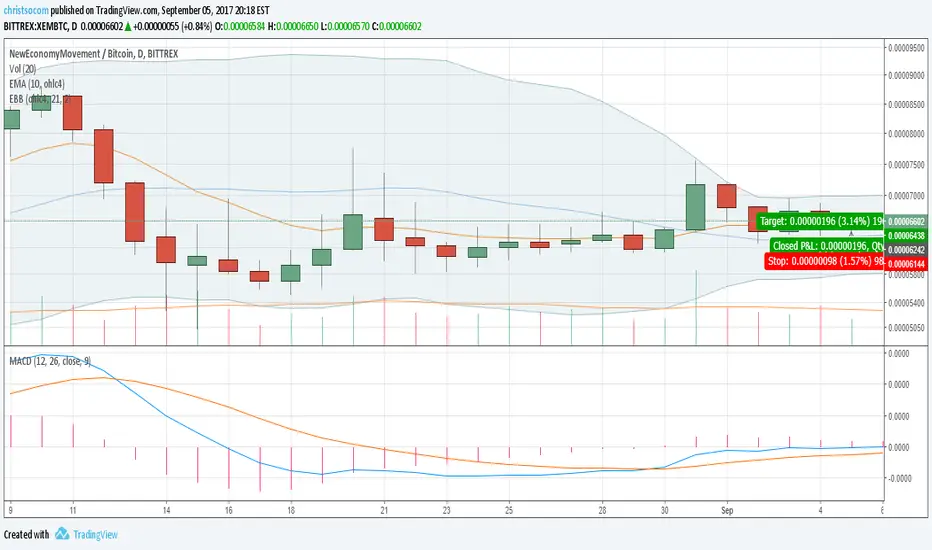
The standard Bolling Bands assumes a normal distribution. However, a normal distribution is an incorrect model for stock prices. This is because stock prices cannot fall below zero. If we assume that the percentage return follows a normal distribution, then a lognormal distribution is a more accurate model.
This is why I've transformed the standard deviation using the log function. It's much more useful for stock prices that have a low value and high volatility.
This is why I've transformed the standard deviation using the log function. It's much more useful for stock prices that have a low value and high volatility.
リリースノート
The standard Bolling Bands assumes a normal distribution. However, a normal distribution is an incorrect model for stock prices. This is because stock prices cannot fall below zero. If we assume that the percentage return follows a normal distribution, then a lognormal distribution is a more accurate model. This is why I've transformed the standard deviation using the log function. It's much more useful for stock prices that have a low value and high volatility .
招待専用スクリプト
このスクリプトは作者が承認したユーザーのみアクセス可能です。使用するにはアクセス申請をして許可を得る必要があります。通常は支払い後に承認されます。詳細は下記の作者の指示に従うか、christsocomに直接お問い合わせください。
TradingViewは、作者を完全に信頼し、スクリプトの動作を理解していない限り、有料スクリプトの購入・使用を推奨しません。コミュニティスクリプトには無料のオープンソースの代替が多数あります。
作者の指示
免責事項
この情報および投稿は、TradingViewが提供または推奨する金融、投資、トレード、その他のアドバイスや推奨を意図するものではなく、それらを構成するものでもありません。詳細は利用規約をご覧ください。