INVITE-ONLY SCRIPT
Multi-Timeframe Close and Midpoint Confluence
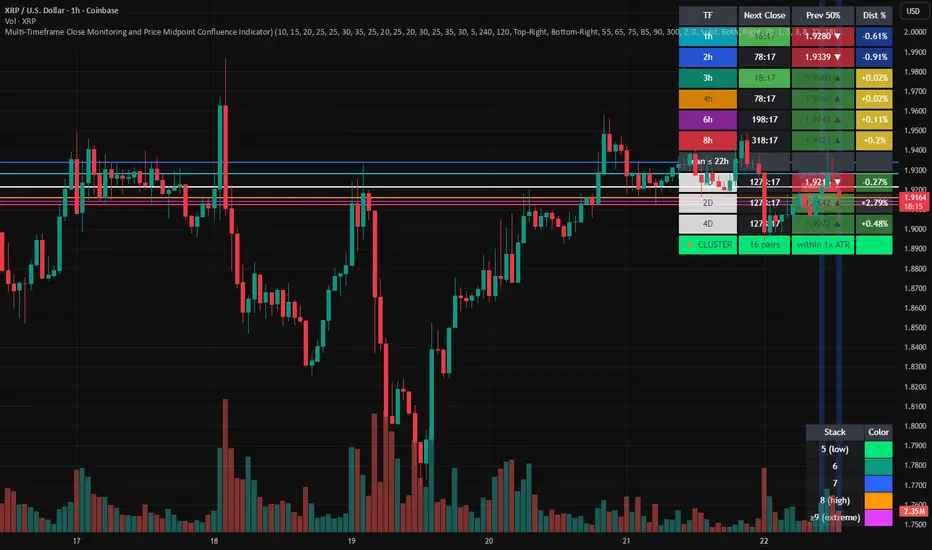
Multi-Timeframe Close Monitoring and Price Midpoint Confluence Indicator
This indicator is designed to assist traders in monitoring multiple timeframe candle closes and identifying areas where price midpoints (50% levels) from different timeframes cluster together.
The tool focuses on timing awareness and structural context, helping users observe periods where multiple timeframe events occur close together, which may coincide with increased market activity.
What the Indicator Tracks
The indicator monitors candle close timing and price context across multiple timeframes, including:
Intraday timeframe closes (30m, 1h, 2h, 3h, 4h, 6h, 8h)
Higher-timeframe closes (Daily, Weekly, Monthly) when within a defined scan window
The midpoint (50%) of the previous candle for each tracked timeframe
The distance between current price and each midpoint level
This information is evaluated independently for each timeframe.
Timeframe Close Confluence
When multiple timeframes are approaching a candle close within a short window, the indicator highlights this period visually.
These moments can be useful for observing potential shifts in activity or volatility, particularly when combined with other forms of analysis.
Visual markers and optional alerts are used to draw attention to these timing clusters.
Midpoint (50%) Level Clustering
The indicator also evaluates whether multiple 50% levels from different timeframes are located within a user-defined proximity.
When several midpoints cluster closely together, the area is highlighted as a zone of interest for further observation, as overlapping price references may act as areas of interaction.
Countdown & Information Panel
An optional on-chart panel displays:
A live countdown to upcoming timeframe closes
Relative urgency based on proximity to each close
Whether current price is above or below each midpoint
Distance metrics to help gauge proximity
Color coding is used to improve readability rather than indicate trade direction.
Visual Context Tools
Additional visual options include:
Background shading when multiple timing or midpoint conditions overlap
Adjustable thresholds to control sensitivity
Customizable colors, opacity, and panel placement
These visuals are intended to provide contextual awareness, not trade signals.
Intended Use
Style: Multi-timeframe analysis and timing awareness
Markets: Forex, crypto, equities, futures
Purpose:
Monitor upcoming timeframe closes
Observe overlapping price reference zones
Improve preparation around potential activity windows
The indicator is best used as a supplementary tool alongside independent analysis.
Important Notes
This script is provided for educational and analytical purposes only.
It does not predict market outcomes and should not be used as a standalone decision-making tool. Users are encouraged to apply appropriate risk controls and confirm observations with additional analysis.
招待専用スクリプト
このスクリプトは作者が承認したユーザーのみアクセス可能です。使用するにはアクセス申請をして許可を得る必要があります。通常は支払い後に承認されます。詳細は下記の作者の指示に従うか、Marketscannerprosに直接お問い合わせください。
TradingViewは、作者を完全に信頼し、スクリプトの動作を理解していない限り、有料スクリプトの購入・使用を推奨しません。コミュニティスクリプトには無料のオープンソースの代替が多数あります。
作者の指示
This script is invite-only. Please contact me via private message on TradingView to request access.
MarketScanner Pros is an all-in-one trading suite built by traders, for traders.
免責事項
この情報および投稿は、TradingViewが提供または推奨する金融、投資、トレード、その他のアドバイスや推奨を意図するものではなく、それらを構成するものでもありません。詳細は利用規約をご覧ください。