OPEN-SOURCE SCRIPT
Volatility Price Range
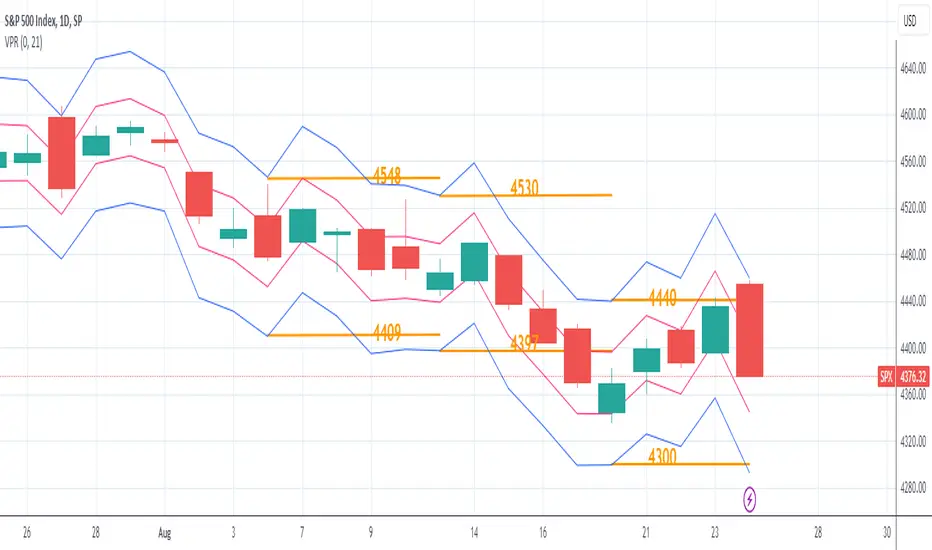
The Volatility Price Range is an overlay which estimates a price range for the next seven days and next day, based on historical volatility (already available in TradingView). The upper and lower bands are calculated as follows:
The Volatility for one week is calculated using the formula: WV = HV * √t where:
WV: one-week volatility
HV: annual volatility
√: square root
t: the time factor expressed in years
From this formula we can deduce the weekly volatility WV = HV * √(1 / 52) = HV / 7.2 where 52: weeks in a year.
The daily volatility DV = HV * √(1 / 365) = HV / 19.1 where 365: days in a year.
To calculate the lower and upper value of the bands, the weekly/daily volatility value obtained will be subtracted/added from/to the current price.
オープンソーススクリプト
TradingViewの精神に則り、このスクリプトの作者はコードをオープンソースとして公開してくれました。トレーダーが内容を確認・検証できるようにという配慮です。作者に拍手を送りましょう!無料で利用できますが、コードの再公開はハウスルールに従う必要があります。
免責事項
この情報および投稿は、TradingViewが提供または推奨する金融、投資、トレード、その他のアドバイスや推奨を意図するものではなく、それらを構成するものでもありません。詳細は利用規約をご覧ください。
オープンソーススクリプト
TradingViewの精神に則り、このスクリプトの作者はコードをオープンソースとして公開してくれました。トレーダーが内容を確認・検証できるようにという配慮です。作者に拍手を送りましょう!無料で利用できますが、コードの再公開はハウスルールに従う必要があります。
免責事項
この情報および投稿は、TradingViewが提供または推奨する金融、投資、トレード、その他のアドバイスや推奨を意図するものではなく、それらを構成するものでもありません。詳細は利用規約をご覧ください。