OPEN-SOURCE SCRIPT
ETH vs BTC 200W SMA Overextension
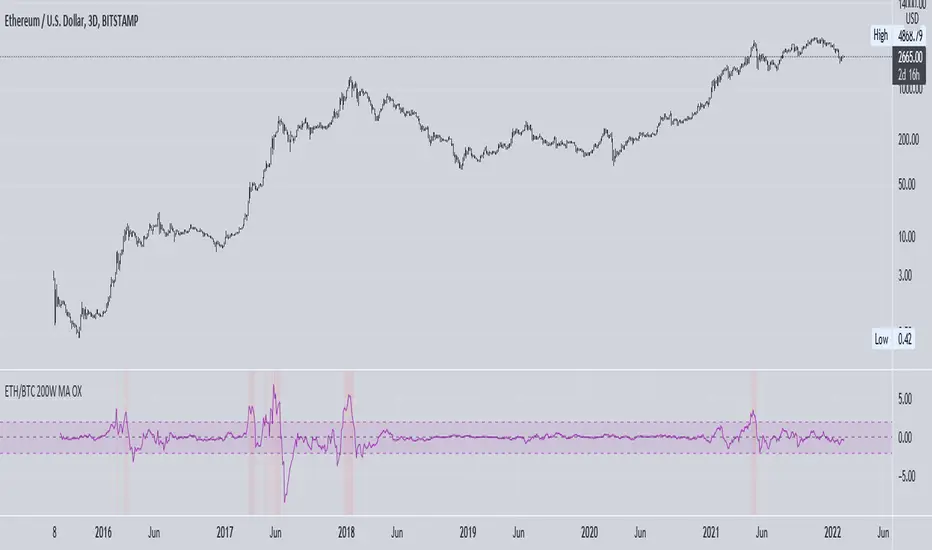
Historically, when BTC suffers a correction and ETH continues to rally, this hints at an impending market-wide correction. In Jan 2018, ETH rallies while BTC corrects, signalling the end of the bull cycle. In May 2021, ETH rallies while BTC ranges between $50-$60k, then a major correction occurs. This indicator attempts to monitor this phenomenon in order to help spot potential macro tops in the cryptocurrency market.
The indicator takes the price of the asset and divides it by the 200 week SMA value. This gives an over/undervaluation in percentage terms. When ETH becomes significantly more overvalued relative to BTC, the indicator will warn of a potential top forming (see red shaded areas).
This is for edutainment purposes only. Don't make financial decisions based on this indicator.
オープンソーススクリプト
TradingViewの精神に則り、このスクリプトの作者はコードをオープンソースとして公開してくれました。トレーダーが内容を確認・検証できるようにという配慮です。作者に拍手を送りましょう!無料で利用できますが、コードの再公開はハウスルールに従う必要があります。
免責事項
この情報および投稿は、TradingViewが提供または推奨する金融、投資、トレード、その他のアドバイスや推奨を意図するものではなく、それらを構成するものでもありません。詳細は利用規約をご覧ください。
オープンソーススクリプト
TradingViewの精神に則り、このスクリプトの作者はコードをオープンソースとして公開してくれました。トレーダーが内容を確認・検証できるようにという配慮です。作者に拍手を送りましょう!無料で利用できますが、コードの再公開はハウスルールに従う必要があります。
免責事項
この情報および投稿は、TradingViewが提供または推奨する金融、投資、トレード、その他のアドバイスや推奨を意図するものではなく、それらを構成するものでもありません。詳細は利用規約をご覧ください。