PROTECTED SOURCE SCRIPT
Phase Accumulate/Manipulate/Distribute - NY [nainoa_invest]
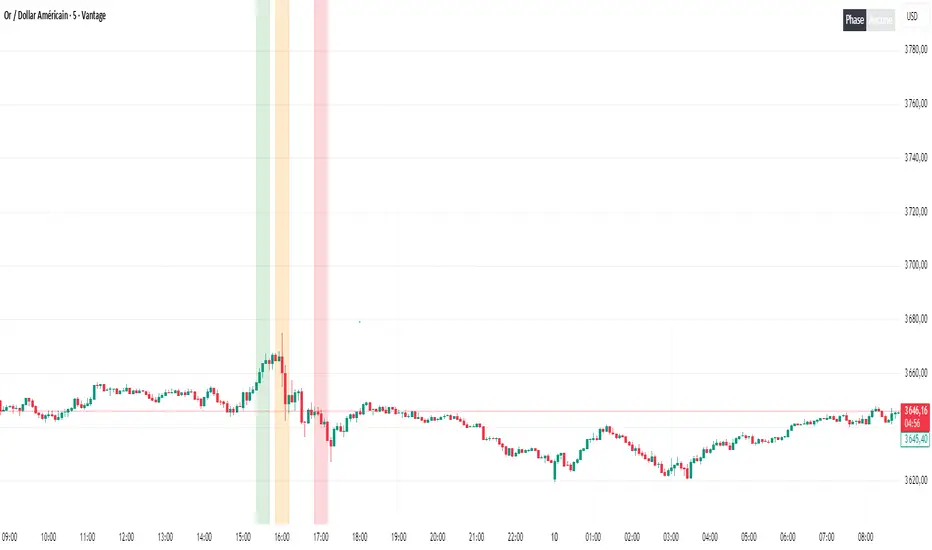
This TradingView script allows you to identify and visualize the different phases of an asset in the New York market (EST/GMT-4): Accumulation, Manipulation, and Distribution.
Key Features:
Phase Visualization on Chart: Each phase is displayed as a colored rectangle (green for accumulation, orange for manipulation, red for distribution) to easily track market movements.
Dynamic Dashboard: A table shows the current phase in real-time directly on the chart, with customizable colors.
Customizable Settings: You can adjust phase colors, dashboard position and size, and border style.
Precise Time Windows: Phases are automatically calculated based on specific NY session hours for better market behavior tracking.
This script is ideal for traders who want to quickly identify key market phases and make more informed trading decisions.
If you want to use this script, you can contact me directly.
保護スクリプト
このスクリプトのソースコードは非公開で投稿されています。 無料かつ制限なしでご利用いただけます ― 詳細についてはこちらをご覧ください。
免責事項
これらの情報および投稿は、TradingViewが提供または保証する金融、投資、取引、またはその他の種類のアドバイスや推奨を意図したものではなく、またそのようなものでもありません。詳しくは利用規約をご覧ください。
保護スクリプト
このスクリプトのソースコードは非公開で投稿されています。 無料かつ制限なしでご利用いただけます ― 詳細についてはこちらをご覧ください。
免責事項
これらの情報および投稿は、TradingViewが提供または保証する金融、投資、取引、またはその他の種類のアドバイスや推奨を意図したものではなく、またそのようなものでもありません。詳しくは利用規約をご覧ください。