PROTECTED SOURCE SCRIPT
更新済 SD Trend with Signals
SD Trend Indicator
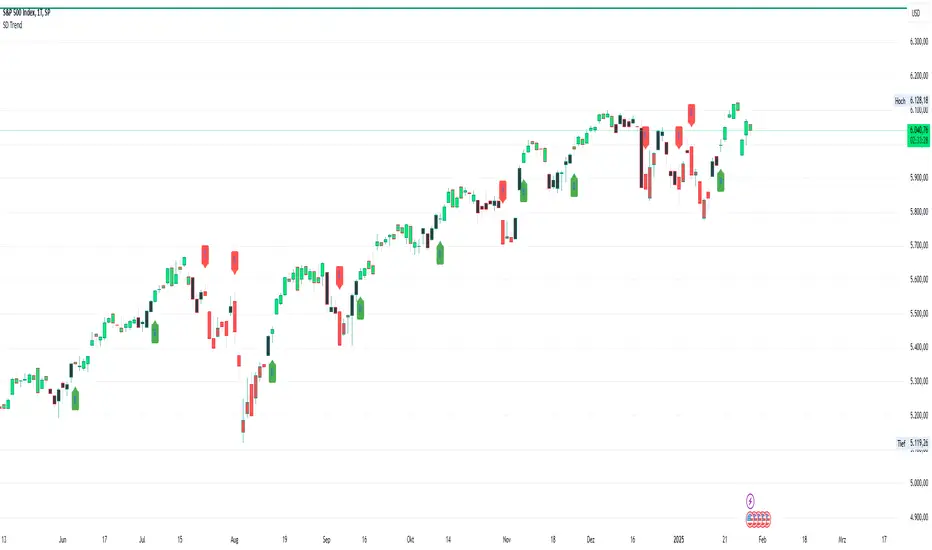
The SD Trend Indicator is a trend-following tool designed to help traders identify potential buy and sell signals based on a combination of technical indicators: MACD, RSI, and Stochastic Oscillator. It visually enhances price action by color-coding candles and plotting signals when a trend shift occurs.
How It Works:
MACD (12, 26, 9): Measures momentum and trend direction.
RSI (7): Identifies overbought and oversold conditions.
Stochastic Oscillator (14, 3, 3): Confirms trend strength and reversals.
Candle Color Coding:
Green → Bullish (Buy Condition)
Red → Bearish (Sell Condition)
Black → Neutral (No Trade)
Signal Generation:
A Buy Signal (B) is plotted below the first green candle after a neutral (black) phase.
A Sell Signal (S) is plotted above the first red candle after a neutral (black) phase.
This helps traders capture early trend reversals with clear visual confirmation.
Key Features:
✔️ Trend Confirmation using three proven indicators.
✔️ Clear Candle Coloring for easy trend visualization.
✔️ Buy/Sell Labels (B/S) for quick decision-making.
✔️ Works on any timeframe and asset class (stocks, forex, crypto, etc.).
This indicator is ideal for traders looking to follow trends, identify potential reversals, and improve entry/exit timing with a systematic approach
リリースノート
SD Trend IndicatorThe SD Trend Indicator is a trend-following tool designed to help traders identify potential buy and sell signals based on a combination of technical indicators: MACD, RSI, and Stochastic Oscillator. It visually enhances price action by color-coding candles and plotting signals when a trend shift occurs.
How It Works:
MACD (12, 26, 9): Measures momentum and trend direction.
RSI (7): Identifies overbought and oversold conditions.
Stochastic Oscillator (14, 3, 3): Confirms trend strength and reversals.
Candle Color Coding:
Green → Bullish (Buy Condition)
Red → Bearish (Sell Condition)
Black → Neutral (No Trade)
Signal Generation:
A Buy Signal (B) is plotted below the first green candle after a neutral (black) phase.
A Sell Signal (S) is plotted above the first red candle after a neutral (black) phase.
This helps traders capture early trend reversals with clear visual confirmation.
Key Features:
✔️ Trend Confirmation using three proven indicators.
✔️ Clear Candle Coloring for easy trend visualization.
✔️ Buy/Sell Labels (B/S) for quick decision-making.
✔️ Works on any timeframe and asset class (stocks, forex, crypto, etc.).
This indicator is ideal for traders looking to follow trends, identify potential reversals, and improve entry/exit timing with a systematic approach
***UPDATE***
- updated to pine script version 6.0
- new alarm function to set alarms every time a new green candle is plotted!
保護スクリプト
このスクリプトのソースコードは非公開で投稿されています。 ただし、制限なく自由に使用できます – 詳細はこちらでご確認ください。
免責事項
この情報および投稿は、TradingViewが提供または推奨する金融、投資、トレード、その他のアドバイスや推奨を意図するものではなく、それらを構成するものでもありません。詳細は利用規約をご覧ください。
免責事項
この情報および投稿は、TradingViewが提供または推奨する金融、投資、トレード、その他のアドバイスや推奨を意図するものではなく、それらを構成するものでもありません。詳細は利用規約をご覧ください。